

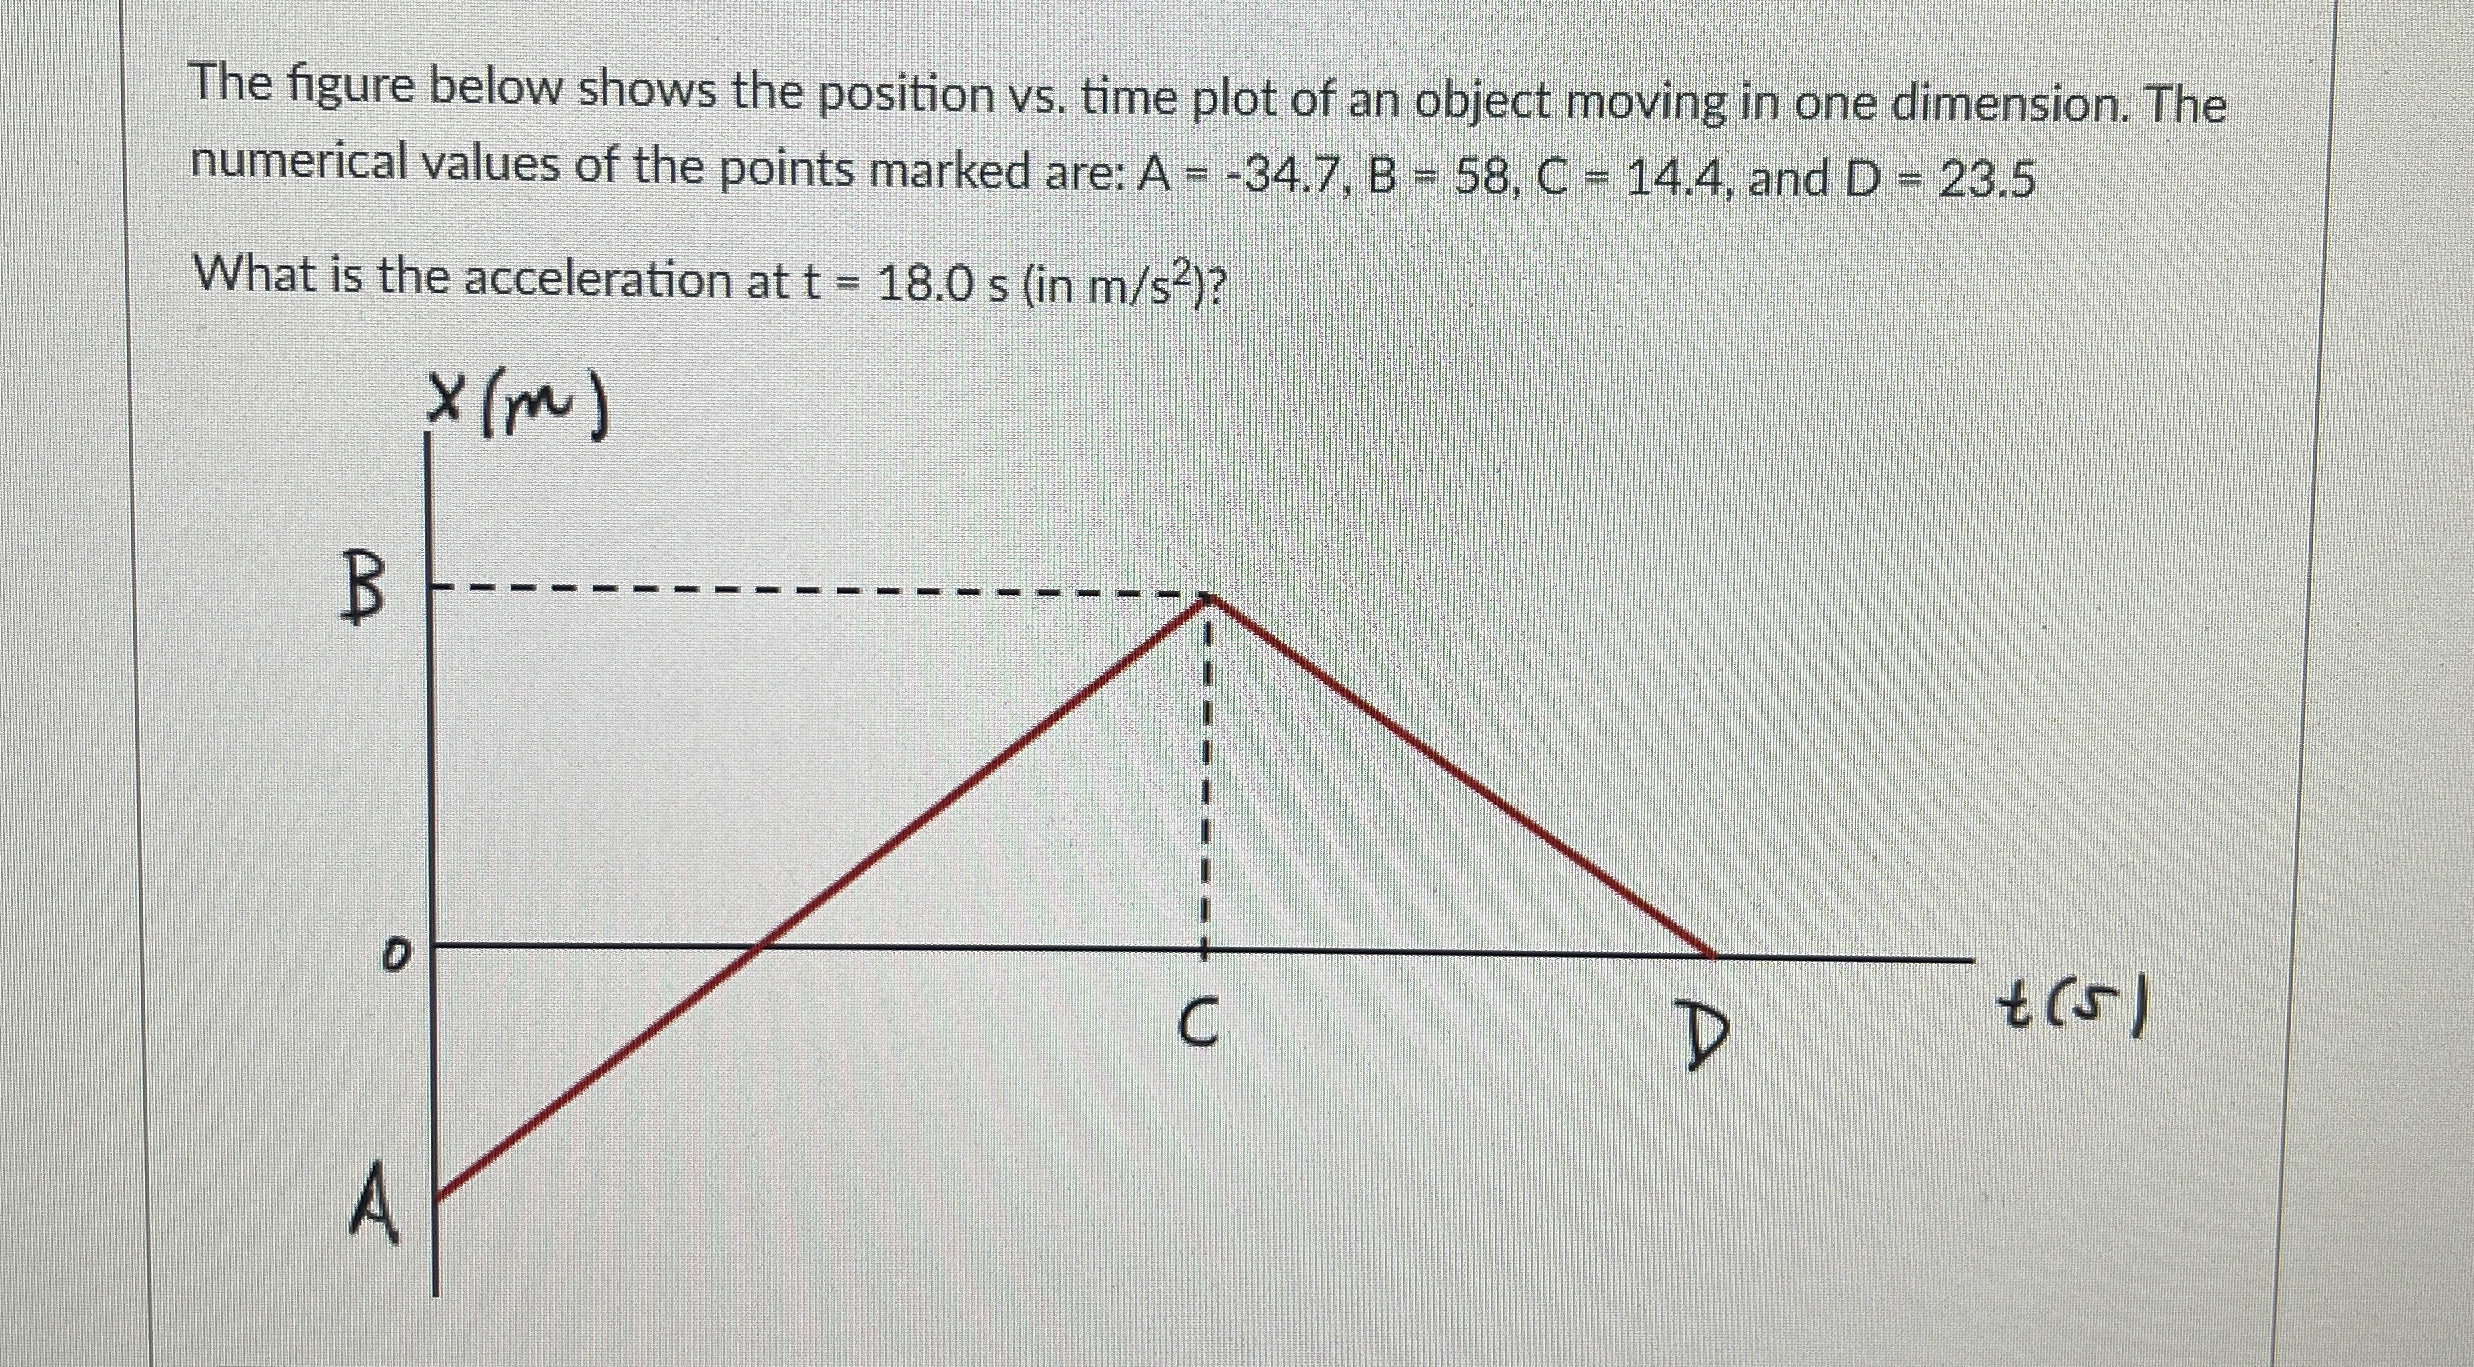
Question: The figure below shows the position vs . time plot of an object moving in one dimension. The numerical values of the points marked are:
The figure below shows the position vs time plot of an object moving in one dimension. The numerical values of the points marked are: and
What is the acceleration at
Step by Step Solution
There are 3 Steps involved in it
1 Expert Approved Answer
Step: 1 Unlock

Question Has Been Solved by an Expert!
Get step-by-step solutions from verified subject matter experts
Step: 2 Unlock
Step: 3 Unlock