

Question: The figure below shows the saving function for an economy. a Complete the table below. b. Add the consumption function to the figure above. Plot
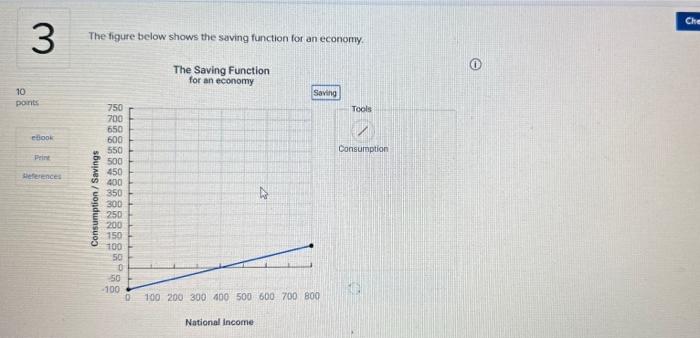
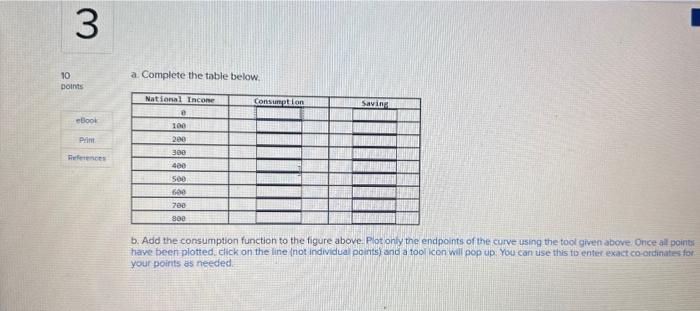
The figure below shows the saving function for an economy. a Complete the table below. b. Add the consumption function to the figure above. Plot only the endpoints of the curve using the tool given above Once all points have been plotted, elick on the line (not individual points) and a tool icon will pop up. You can use this to enter exact co-ordinates for yourpoints as needed
Step by Step Solution
There are 3 Steps involved in it
1 Expert Approved Answer
Step: 1 Unlock

Question Has Been Solved by an Expert!
Get step-by-step solutions from verified subject matter experts
Step: 2 Unlock
Step: 3 Unlock