

Question: The Figure given below represents a Gilliland Correlation for determination a Number of stages in multi component distillation: based on the data plotted on the
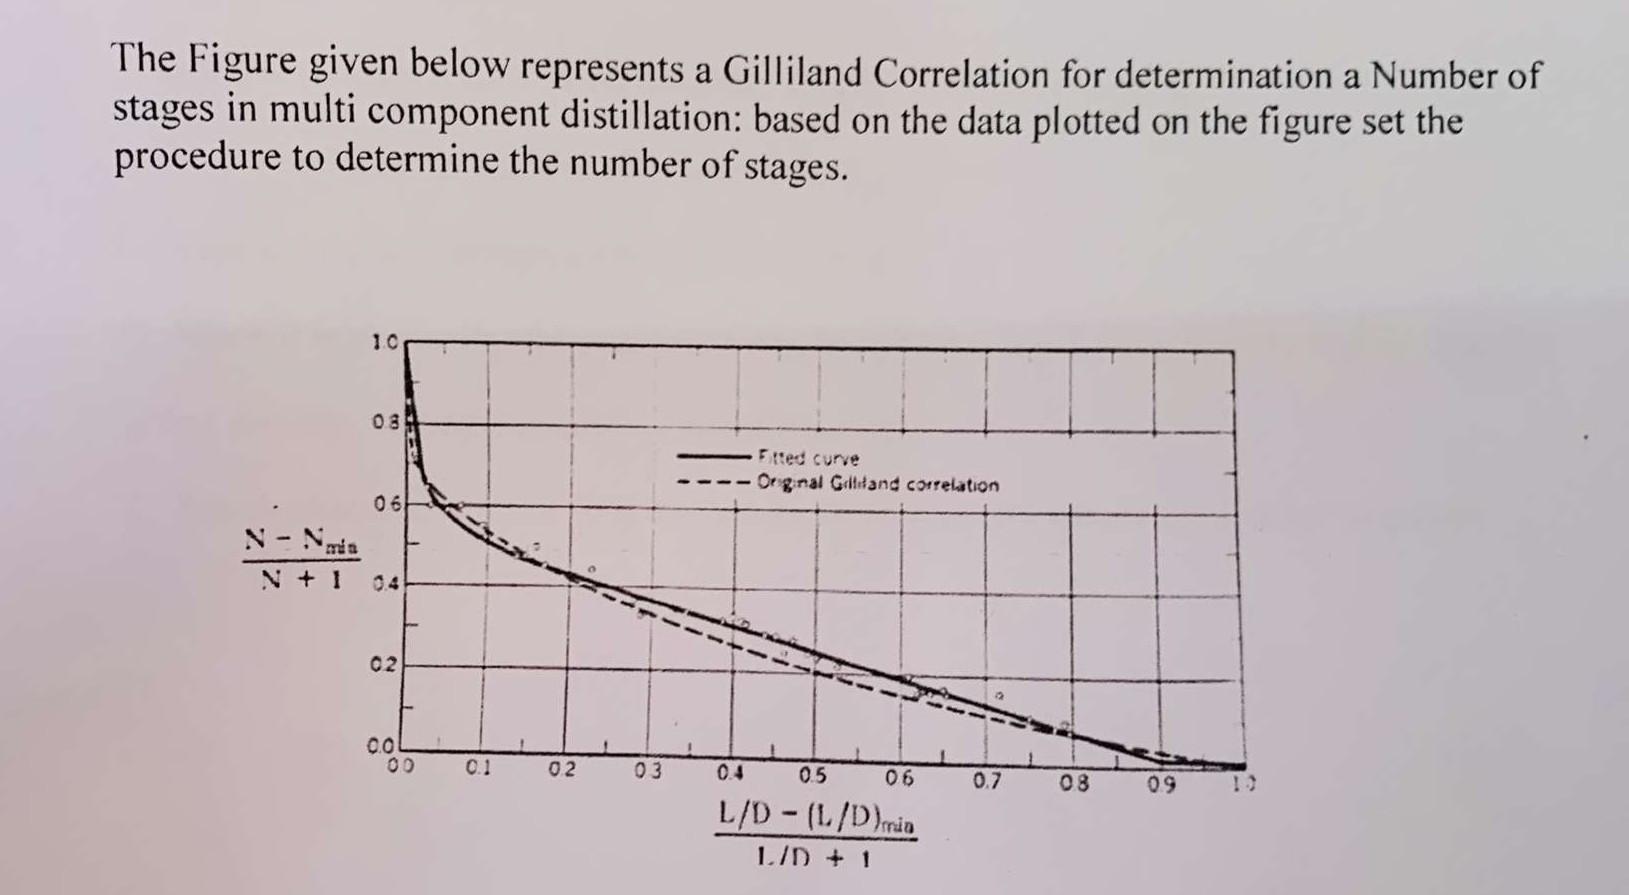
The Figure given below represents a Gilliland Correlation for determination a Number of stages in multi component distillation: based on the data plotted on the figure set the procedure to determine the number of stages. The Figure given below represents a Gilliland Correlation for determination a Number of stages in multi component distillation: based on the data plotted on the figure set the procedure to determine the number of stages
Step by Step Solution
There are 3 Steps involved in it
1 Expert Approved Answer
Step: 1 Unlock

Question Has Been Solved by an Expert!
Get step-by-step solutions from verified subject matter experts
Step: 2 Unlock
Step: 3 Unlock