

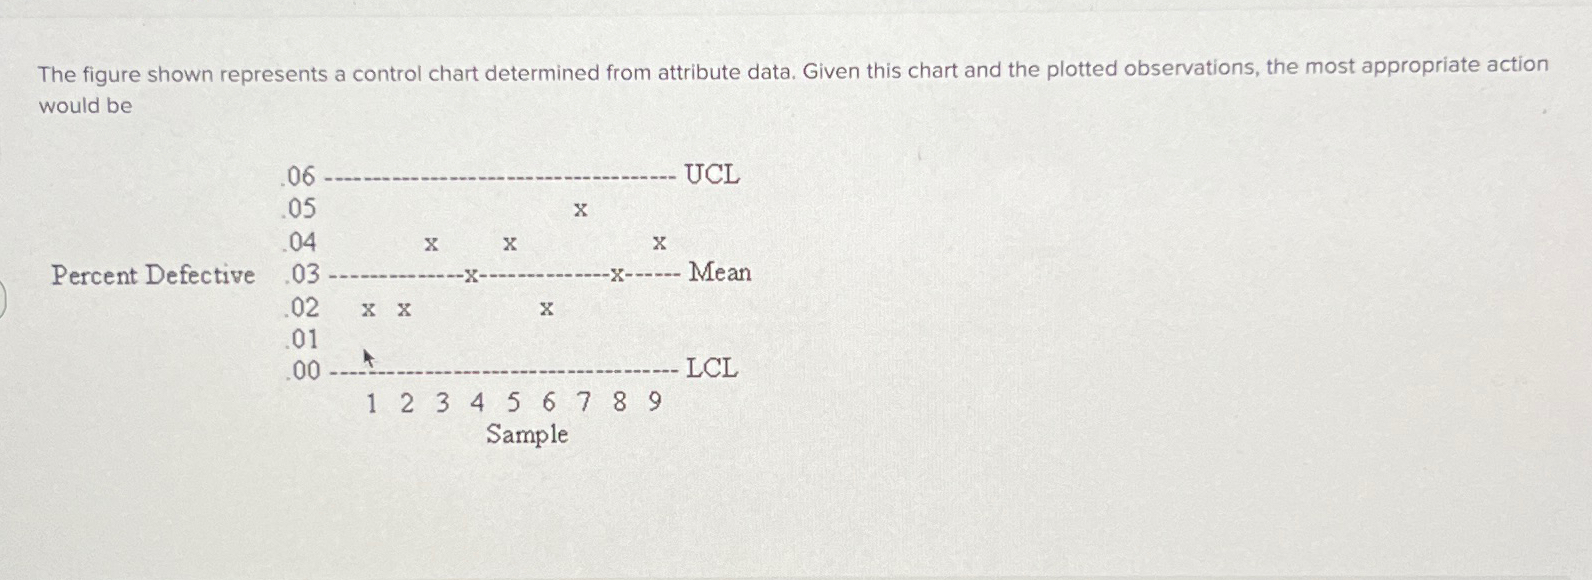
Question: The figure shown represents a control chart determined from attribute data. Given this chart and the plotted observations, the most appropriate action would be
The figure shown represents a control chart determined from attribute data. Given this chart and the plotted observations, the most appropriate action would be
Step by Step Solution
There are 3 Steps involved in it
1 Expert Approved Answer
Step: 1 Unlock

Question Has Been Solved by an Expert!
Get step-by-step solutions from verified subject matter experts
Step: 2 Unlock
Step: 3 Unlock