

Question: The figure shown to the right is a slight modification of the one shown on slide 57 of the '08 Bernoulli Equation Part II' notes.
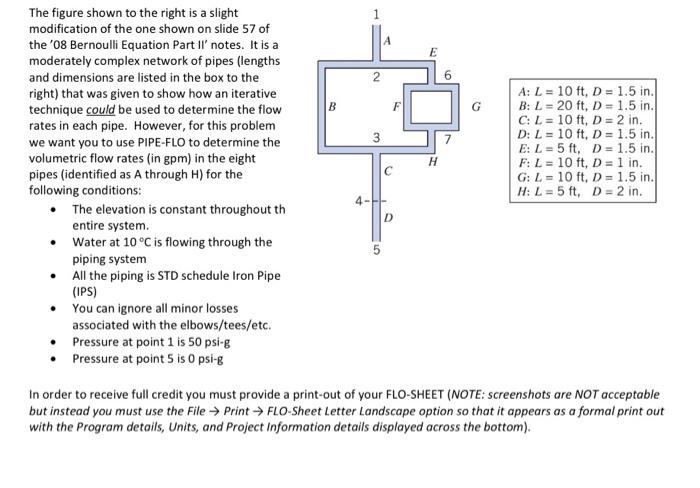
The figure shown to the right is a slight modification of the one shown on slide 57 of the '08 Bernoulli Equation Part II' notes. It is a moderately complex network of pipes (lengths and dimensions are listed in the box to the right) that was given to show how an iterative technique could be used to determine the flow rates in each pipe. However, for this problem we want you to use PIPE-FLO to determine the volumetric flow rates (in gpm) in the eight pipes (identified as A through H ) for the following conditions: - The elevation is constant throughout th entire system. - Water at 10C is flowing through the piping system - All the piping is STD schedule Iron Pipe (IPS) - You can ignore all minor losses associated with the elbows/tees/etc. - Pressure at point 1 is 50 psi-g - Pressure at point 5 is 0 psi-g In order to receive full credit you must provide a print-out of your FLO-SHEET (NOTE: screenshots are NOT acceptable but instead you must use the File Print FLO-Sheet Letter Landscape option so that it appears as a formal print out with the Program details, Units, and Project Information details displayed across the bottom)
Step by Step Solution
There are 3 Steps involved in it

Get step-by-step solutions from verified subject matter experts