

Question: The figure shows a student's production function with the final grade ( the output ) related to the number of hours spent studying ( the
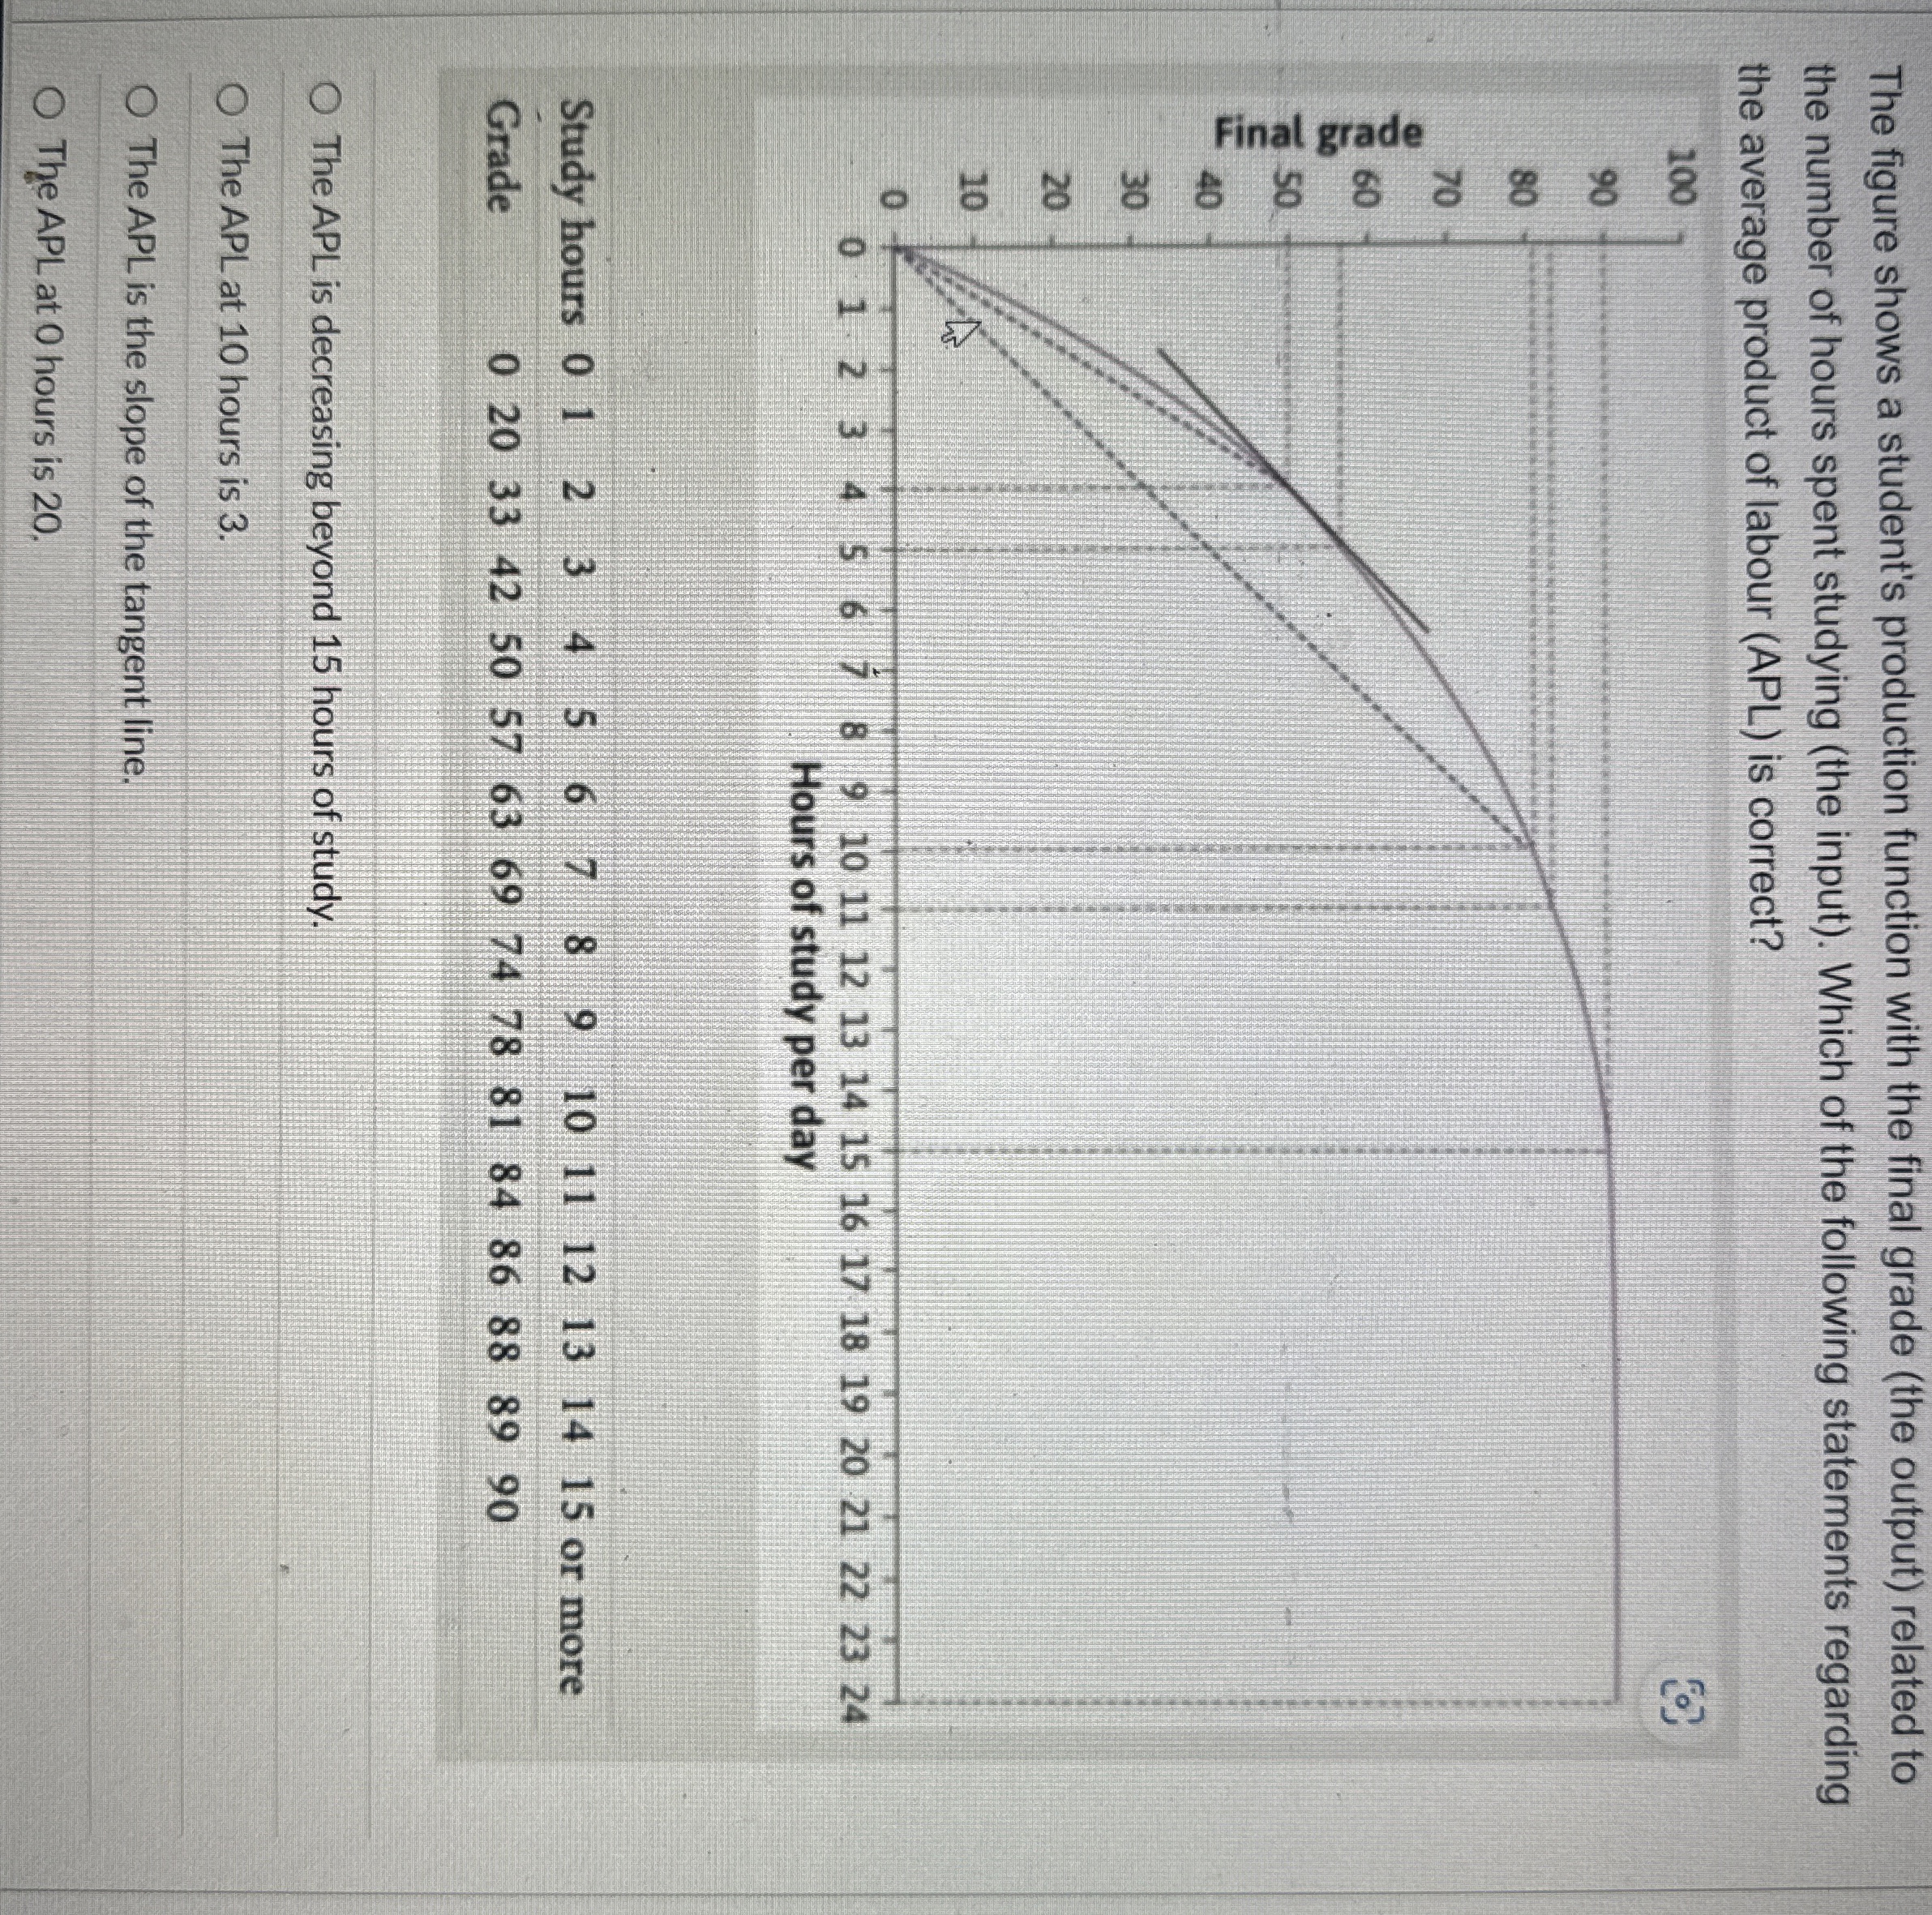
The figure shows a student's production function with the final grade the output related to the number of hours spent studying the input Which of the following statements regarding the average product of labour APL is correct?
tableStudy hours, or moreGrade
The APL is decreasing beyond hours of study.
The APL at hours is
The APL is the slope of the tangent line.
The APL at hours is
Step by Step Solution
There are 3 Steps involved in it
1 Expert Approved Answer
Step: 1 Unlock

Question Has Been Solved by an Expert!
Get step-by-step solutions from verified subject matter experts
Step: 2 Unlock
Step: 3 Unlock