

Question: The figure shows the circular flow model. During 2020, flow A was $278 billion, flow B was $158 billion, flow D was $56 billion,
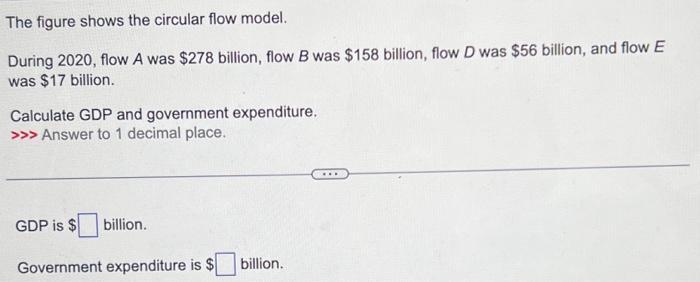
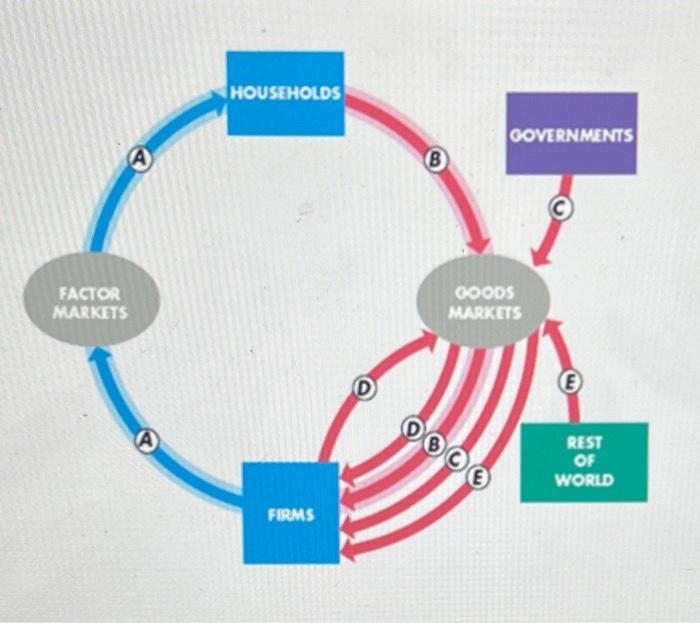
The figure shows the circular flow model. During 2020, flow A was $278 billion, flow B was $158 billion, flow D was $56 billion, and flow E was $17 billion. Calculate GDP and government expenditure. >>> Answer to 1 decimal place. GDP is $ billion. Government expenditure is $ billion. A FACTOR MARKETS A HOUSEHOLDS FIRMS D B GOVERNMENTS GOODS MARKETS DOCE E REST OF WORLD
Step by Step Solution
★★★★★
3.53 Rating (156 Votes )
There are 3 Steps involved in it
1 Expert Approved Answer
Step: 1 Unlock

Given information Flow A 278 billion Flow B 158 billion Flow ... View full answer
Question Has Been Solved by an Expert!
Get step-by-step solutions from verified subject matter experts
Step: 2 Unlock
Step: 3 Unlock