

The figure to the right shows a map of the Weddell Sea, off the coast of Antarctica.
Question:
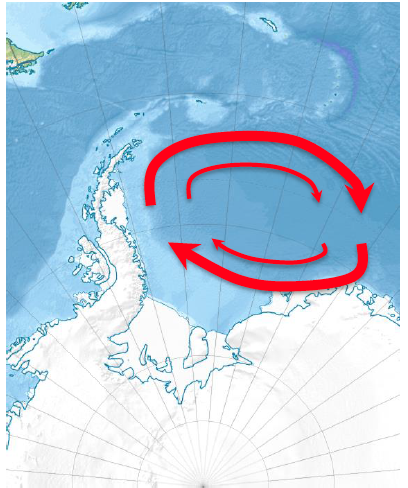
The figure to the right shows a map of the Weddell Sea, off the coast of Antarctica. The arrows indicate the direction and strength of the surface winds (thicker arrows mean stronger winds). a) In which direction to the winds drive surface waters in the Ekman layer? Explain why the balance of forces in the Ekman layer leads to this direction of transport. You may find it helpful to include a sketch. b) Assume that the Weddell Sea is circular with a radius of Rg=680 km, and that the clockwise wind speed around its circumference have a speed of 7 m/s. Assuming a drag coefficient of cD = 1.25 x 10⁻³, use the formula from the lecture slides to calculate the wind stress, and then calculate the total transport across the circumference of the Weddell Sea. For this calculation you may assume a constant latitude of 65oS, that the ocean surface density is 1027 kg/m3, and that the density of air is 1.3 kg/m3. (5P) c) From the standpoint of Ekman transport, explain how cyclonic surface winds cause the circulation of the Weddell Gyre. Sketch the resulting expected shapes of the sea surface height and the thermocline depth as a function of distance from the center of the gyre, including the resulting geostrophic velocity and its variation with depth.
Expert Answer:
answer In the map of Weddell sea the movement of wind is shown strong wind are represent by the thic... View the full answer


