

Question: The file indices contains data that represent the total rate of return percentage for the Dow Jones Industrial Average (DJIA), the Standard & Poor's 500
The file indices contains data that represent the total rate of return percentage for the Dow Jones Industrial Average (DJIA), the Standard & Poor's 500 (S&P 500), and the technology-heavy NASDAQ Composite (NASDAQ) from 2011 through 2014. These data are:
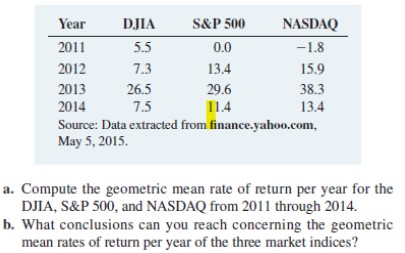
Year D.JIA S&P 500 NASDAQ 2011 5.5 0.0 -1.8 2012 7.3 13.4 15.9 2013 26.5 29.6 38.3 2014 7.5 11.4 13.4 Source: Data extracted from finance.yahoo.com, May 5, 2015. a. Compute the geometric mean rate of return per year for the DJIA, S&P 500, and NASDAQ from 2011 through 2014. b. What conclusions can you reach concerning the geometric mean rates of return per year of the three market indices
Step by Step Solution
There are 3 Steps involved in it

Get step-by-step solutions from verified subject matter experts