

Question: The file P 0 2 _ ( 5 4 . ) xlsx contains daily values of an EPA air quality index in Washington DC and
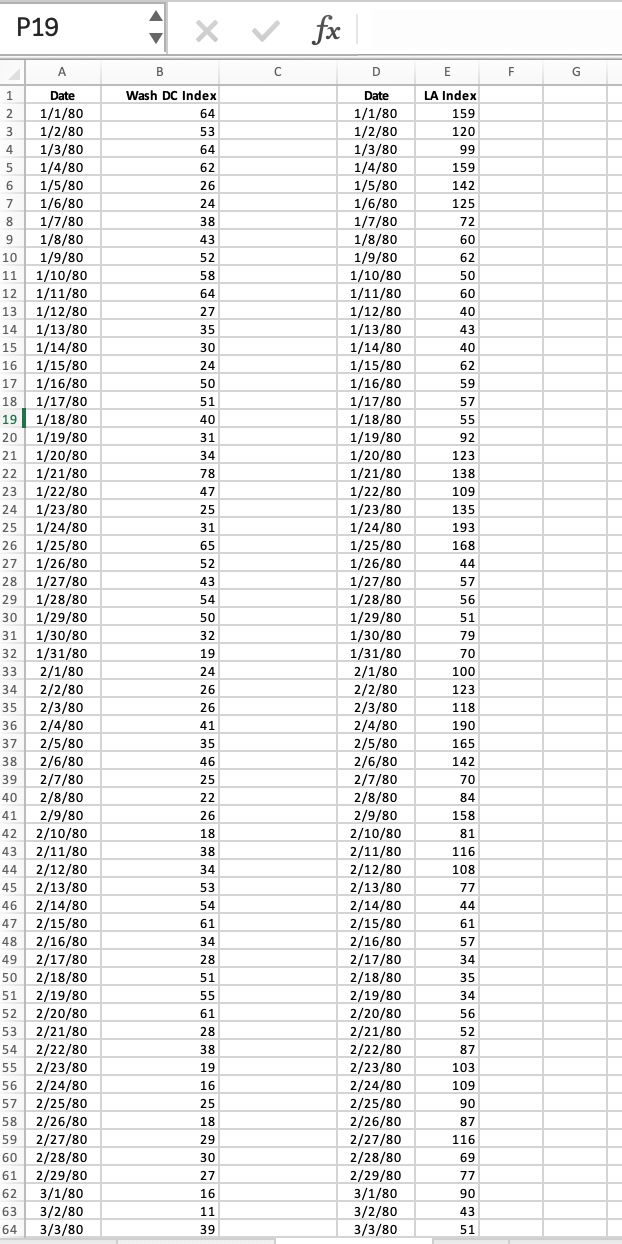
The file Pxlsx contains daily values of an EPA air quality index in Washington DC and Los Angeles from January through April For some unknown reason, the source provides slightly different dates for the two cities.
a
Starting in column G create three new columns: Date, Wash DC Index, and LA Index. Fill the new date column with all dates from to Then, use lookup functions to fill in the two new index columns, entering the observed index if available or a blank otherwise. Hint: Use a combination of the VLOOKUP function with False as the last argument and the IFERROR function. Look up the latter in online help if you have never seen it before.
b
Create a separate time series graph of each new index column. Because there are so many dates, it is difficult to see how the graph deals with missing data, but see if you can determine this maybe by expanding the size of the graph or trying a smaller example Despite the few missing points, explain the patterns in the graphs and how Washington DC compares to Los Angeles.
Step by Step Solution
There are 3 Steps involved in it
1 Expert Approved Answer
Step: 1 Unlock

Question Has Been Solved by an Expert!
Get step-by-step solutions from verified subject matter experts
Step: 2 Unlock
Step: 3 Unlock