

Question: The financial statement for the last three years can be found in Exhibits 1 and 2. The industry averages can be found in Exhibit 3.
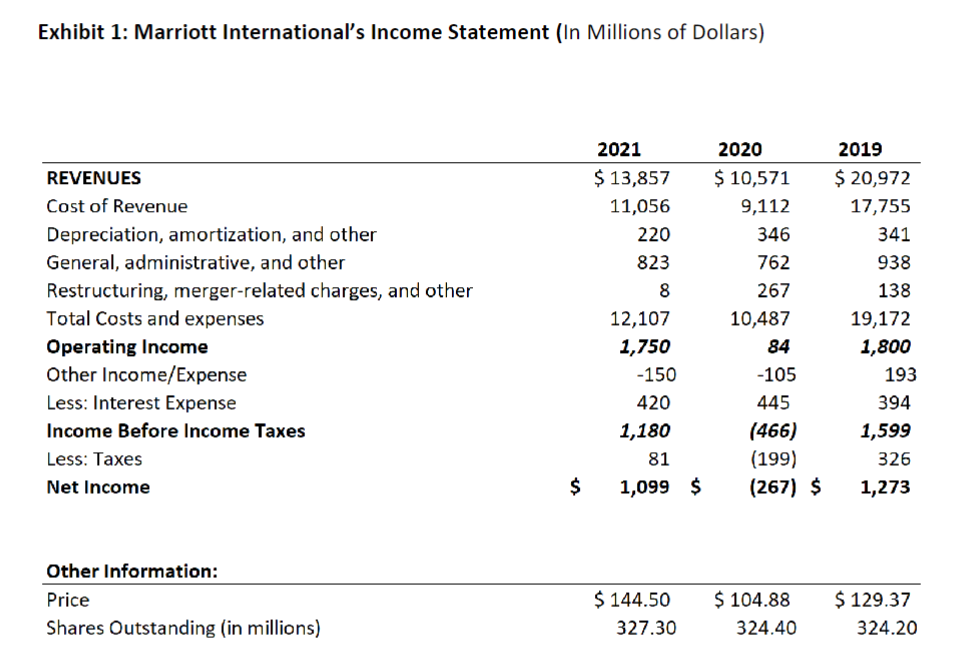
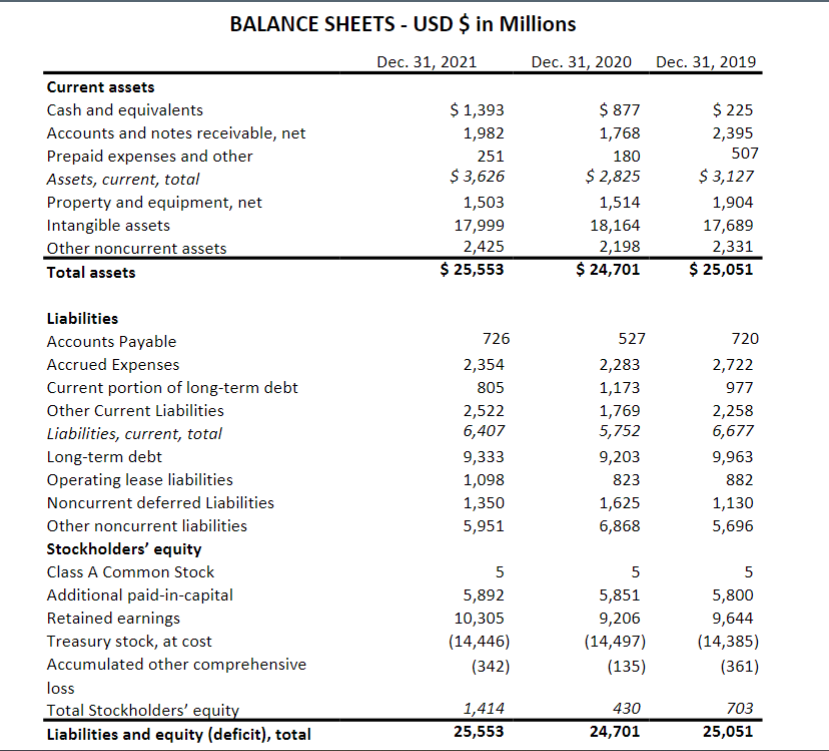
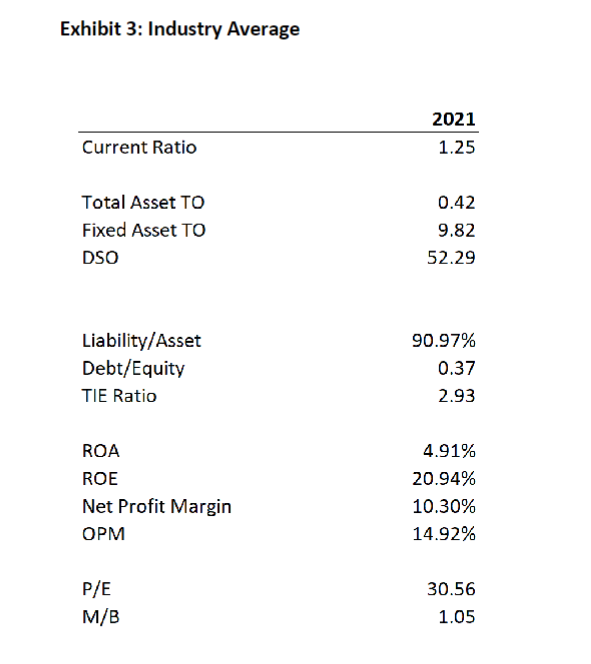
The financial statement for the last three years can be found in Exhibits 1 and 2. The industry averages can be found in Exhibit 3. Also include the following financial exhibits in excel: o Vertical (common size) analysis of income statement and balance sheet o Horizontal (percent-change) analysis of income statement and balance sheet o Complete ratio analysis (for all 3 years) and industry comparison. For each area, the students need to determine if the pandemic and strategic changes made have resulted in an improved and worsening financial position for the company. companys liquidity asset management debt management profitability market value You will submit the excel (saved as an .xlsx file). You only need to do the ratios that correspond with the industry average ration in Exhibit 3.
PLEASE HELP WITH THE EXCEL FORMULA AND SHEET!
Exhibit 1: Marriott International's Income Statement (In Millions of Dollars) BALANCE SHEETS - USD \$ in Millions Dec. 31, 2021 Dec. 31,2020 Dec. 31,2019 Exhibit 3: Industry Average
Step by Step Solution
There are 3 Steps involved in it

Get step-by-step solutions from verified subject matter experts