

Question: The financial statements for 2012 and 2013 for Time Warner Inc. are shown in this popup window, and those for Walt Disney Co. are
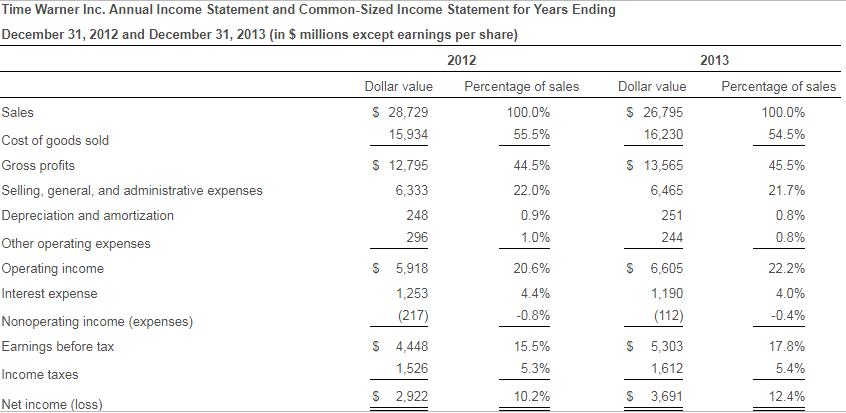
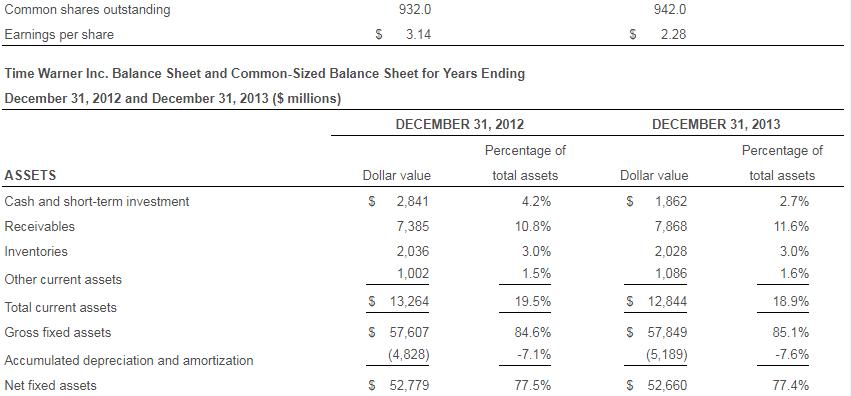
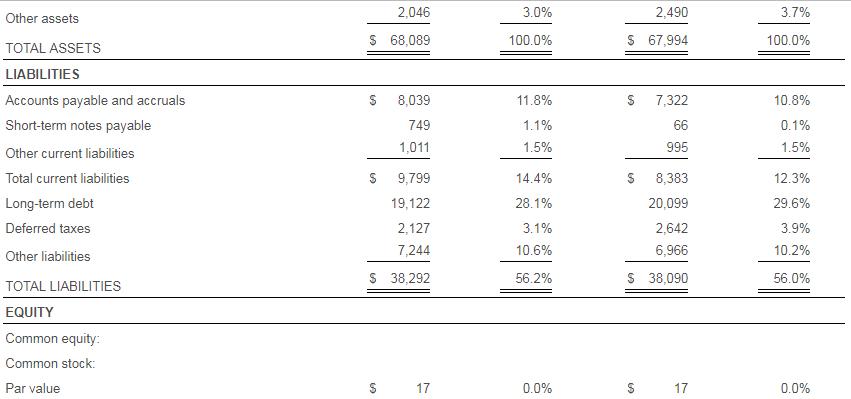
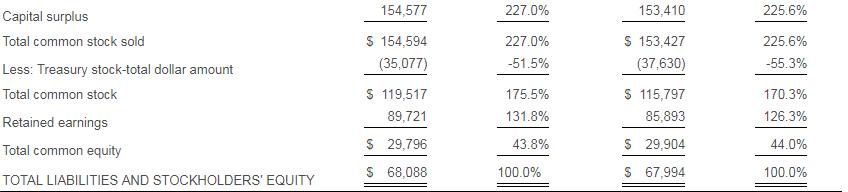
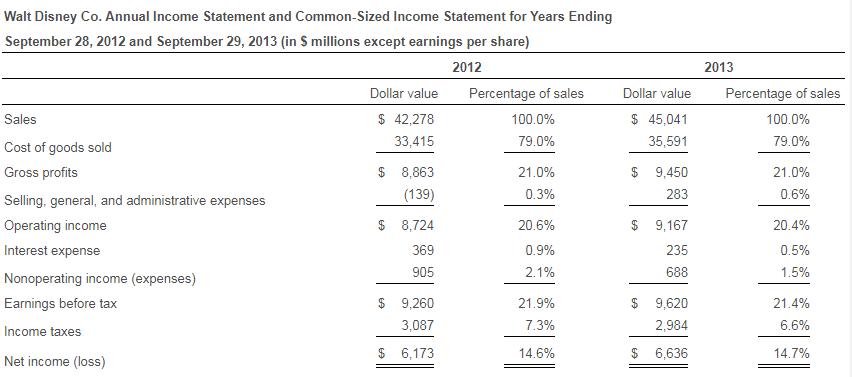

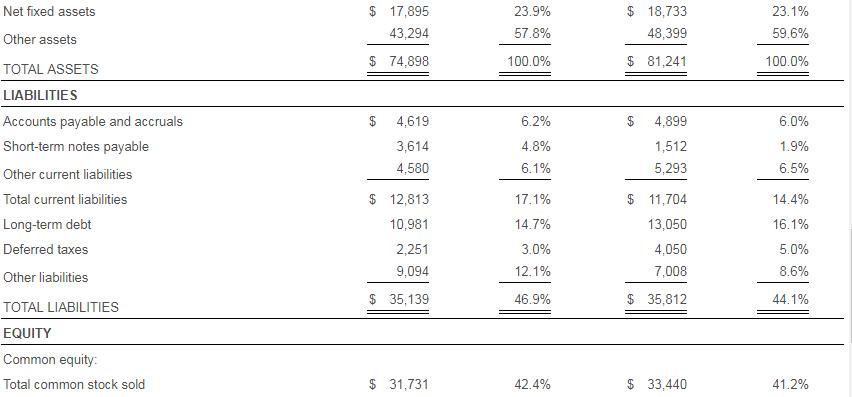

The financial statements for 2012 and 2013 for Time Warner Inc. are shown in this popup window, and those for Walt Disney Co. are shown in this popup window. a. How did Time Warner's profit margins change from 2012 to 2013? To what would you attribute the differences? Answer the same question for Disney. b. Compare the profit margins between Time Warner and Disney. How are they different? How would you explain these differences? c. What differences do you notice in the common-sized balance sheets that might indicate that one of the firms is doing better than the other? a. How did Time Warner's gross profit margin change from 2012 to 2013? % (Round to one decimal place.) Time Warner Inc. Annual Income Statement and Common-Sized Income Statement for Years Ending December 31, 2012 and December 31, 2013 (in $ millions except earnings per share) 2012 Sales Cost of goods sold Gross profits Selling, general, and administrative expenses Depreciation and amortization Other operating expenses Operating income Interest expense Nonoperating income (expenses) Earnings before tax Income taxes Net income (loss) Dollar value $ 28,729 15,934 $ 12,795 6,333 248 296 $ 5,918 1,253 (217) $ 4,448 1,526 $ 2,922 Percentage of sales 100.0% 55.5% 44.5% 22.0% 0.9% 1.0% 20.6% 4.4% -0.8% 15.5% 5.3% 10.2% Dollar value $ 26,795 16,230 $ 13,565 6,465 251 244 $ 6,605 1,190 (112) $ 5,303 1,612 3,691 $ 2013 Percentage of sales 100.0% 54.5% 45.5% 21.7% 0.8% 0.8% 22.2% 4.0% -0.4% 17.8% 5.4% 12.4% Common shares outstanding Earnings per share ASSETS Cash and short-term investment Receivables Inventories Time Warner Inc. Balance Sheet and Common-Sized Balance Sheet for Years Ending December 31, 2012 and December 31, 2013 ($ millions) Other current assets Total current assets Gross fixed assets S Accumulated depreciation and amortization Net fixed assets 932.0 3.14 $ $ DECEMBER 31, 2012 Dollar value $ 2,841 7,385 2,036 1,002 13,264 57,607 (4,828) $ 52,779 Percentage of total assets 4.2% 10.8% 3.0% 1.5% 19.5% 84.6% -7.1% 77.5% 62 $ 942.0 2.28 DECEMBER 31, 2013 Dollar value $ 1,862 7,868 2,028 1,086 $ 12,844 $ 57,849 (5,189) $ 52,660 Percentage of total assets 2.7% 11.6% 3.0% 1.6% 18.9% 85.1% -7.6% 77.4% Other assets TOTAL ASSETS LIABILITIES Accounts payable and accruals Short-term notes payable Other current liabilities Total current liabilities Long-term debt Deferred taxes Other liabilities TOTAL LIABILITIES EQUITY Common equity: Common stock: Par value 2,046 $ 68,089 S S 9,799 19,122 2,127 7,244 $ 38,292 $ 69 8,039 749 1,011 17 3.0% 100.0% 11.8% 1.1% 1.5% 14.4% 28.1% 3.1% 10.6% 56.2% 0.0% 2,490 $ 67,994 S 7,322 66 995 S 8,383 20,099 2,642 6,966 $ 38,090 50 17 3.7% 100.0% 10.8% 0.1% 1.5% 12.3% 29.6% 3.9% 10.2% 56.0% 0.0% Capital surplus Total common stock sold Less: Treasury stock-total dollar amount Total common stock Retained earnings Total common equity TOTAL LIABILITIES AND STOCKHOLDERS' EQUITY 154,577 $ 154,594 (35,077) $ 119,517 89,721 29,796 68,088 $ $ 227.0% 227.0% -51.5% 175.5% 131.8% 43.8% 100.0% 153,410 $ 153,427 (37,630) $ 115,797 85,893 $ 29,904 67,994 225.6% 225.6% -55.3% 170.3% 126.3% 44.0% 100.0% Walt Disney Co. Annual Income Statement and Common-Sized Income Statement for Years Ending September 28, 2012 and September 29, 2013 (in S millions except earnings per share) 2012 Sales Cost of goods sold Gross profits Selling, general, and administrative expenses Operating income Interest expense Nonoperating income (expenses) Earnings before tax Income taxes Net income (loss) Dollar value $ 42,278 33,415 $ 8,863 (139) $ 8,724 369 905 $ 9,260 3,087 $ 6,173 Percentage of sales 100.0% 79.0% 21.0% 0.3% 20.6% 0.9% 2.1% 21.9% 7.3% 14.6% Dollar value $ 45,041 35,591 $ 9,450 283 $ 9,167 235 688 9,620 2,984 $ 6,636 2013 Percentage of sales 100.0% 79.0% 21.0% 0.6% 20.4% 0.5% 1.5% 21.4% 6.6% 14.7% Common shares outstanding Earnings per share ASSETS Cash and cash equivalents Receivables Inventories $ Walt Disney Co. Balance Sheet and Common-Sized Balance Sheet for Years Ending September 28, 2012 and September 29, 2013 ($ millions) Other current assets Total current assets Gross fixed assets Accumulated depreciation and amortization 1,800.0 3.43 September 28, 2012 Dollar value $ 3,387 6,540 1,537 2,245 $ 13,709 $ 38,582 (20,687) Percentage of total assets 4.5% 8.7% 2.1% 3.0% 18.3% 51.5% -27.6% $ 1,800.0 3.69 September 29, 2013 Dollar value $ 3,931 6,967 1,487 1,724 $ 14,109 $ 41,192 (22,459) Percentage of total assets 4.8% 8.6% 1.8% 2.1% 17.4% 50.7% -27.6% Net fixed assets Other assets TOTAL ASSETS LIABILITIES Accounts payable and accruals Short-term notes payable Other current liabilities Total current liabilities Long-term debt Deferred taxes Other liabilities TOTAL LIABILITIES EQUITY Common equity: Total common stock sold $ 17,895 43,294 $ 74,898 4,619 3,614 4,580 $ 12,813 10,981 2,251 9,094 $ 35,139 $ 31,731 23.9% 57.8% 100.0% 6.2% 4.8% 6.1% 17.1% 14.7% 3.0% 12.1% 46.9% 42.4% $ 18,733 48,399 $ 81,241 $ 4,899 1,512 5,293 $ 11,704 13,050 4,050 7,008 $ 35,812 $ 33,440 23.1% 59.6% 100.0% 6.0% 1.9% 6.5% 14.4% 16.1% 5.0% 8.6% 44.1% 41.2% Less: Treasury stock-total dollar amount Total common stock Retained earnings Other equity Total common equity TOTAL LIABILITIES AND STOCKHOLDERS' EQUITY (31,671) 60 42,965 (3,266) $ 39,759 $ 74,898 -42.3% 0.1% 57.4% -4.4% 53.1% 100.0% (34,582) (1,142) 47,758 (1,187) $ 45,429 $ 81,241 -42.6% -1.4% 58.8% -1.5% 55.9% 100.0%
Step by Step Solution
3.45 Rating (161 Votes )
There are 3 Steps involved in it
Solution Solution a Time Warners Particulars Gross Profit Gross Prof... View full answer

Get step-by-step solutions from verified subject matter experts