

Question: The first blank options are (a downward-sloping, a humped, and an upward-sloping) 5. Drawing a yield curve Given the indicated maturities listed in the following
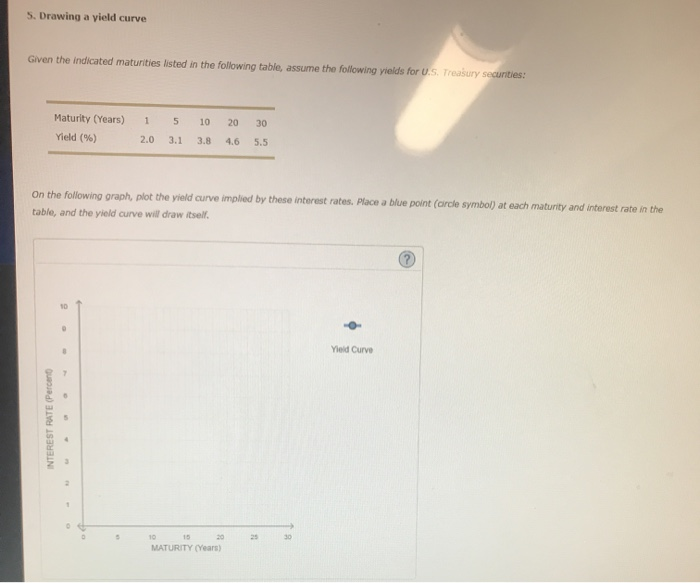
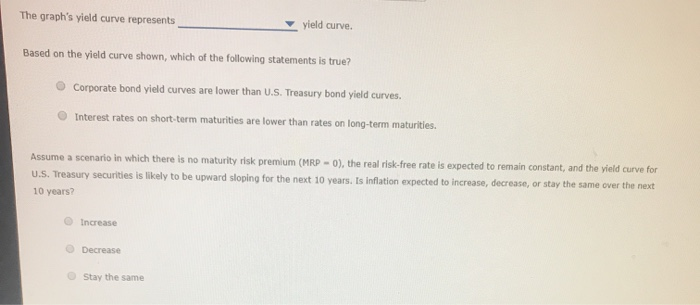
5. Drawing a yield curve Given the indicated maturities listed in the following table, assume the following yields for U.S. Treasury securities: Maturity (Years) Yield (%) 1 2.0 5 3.1 10 3.8 20 4.6 30 5.5 On the following graph, plot the yield curve implied by these interest rates. Place a blue point (circle symbol) at each maturity and interest rate in the table, and the yield curve will draw itsell Yield Curve INTEREST RATE Percent MATURITY (Years The graph's yield curve represents yield curve. Based on the yield curve shown, which of the following statements is true? Corporate bond yield curves are lower than U.S. Treasury bond yield curves. Interest rates on short-term maturities are lower than rates on long-term maturities. Assume a scenario in which there is no maturity risk premium (MRP-0), the real risk-free rate is expected to remain constant, and the yield curve for U.S. Treasury securities is likely to be upward sloping for the next 10 years. Is Inflation expected to increase, decrease, or stay the same over the next 10 years? Increase Decrease Stay the same
Step by Step Solution
There are 3 Steps involved in it

Get step-by-step solutions from verified subject matter experts