

Question: The first case at the end of this chapter and numerous subsequent chapters is a series of integrative cases involving Wal-Mart Stores, Inc. (Walmart).

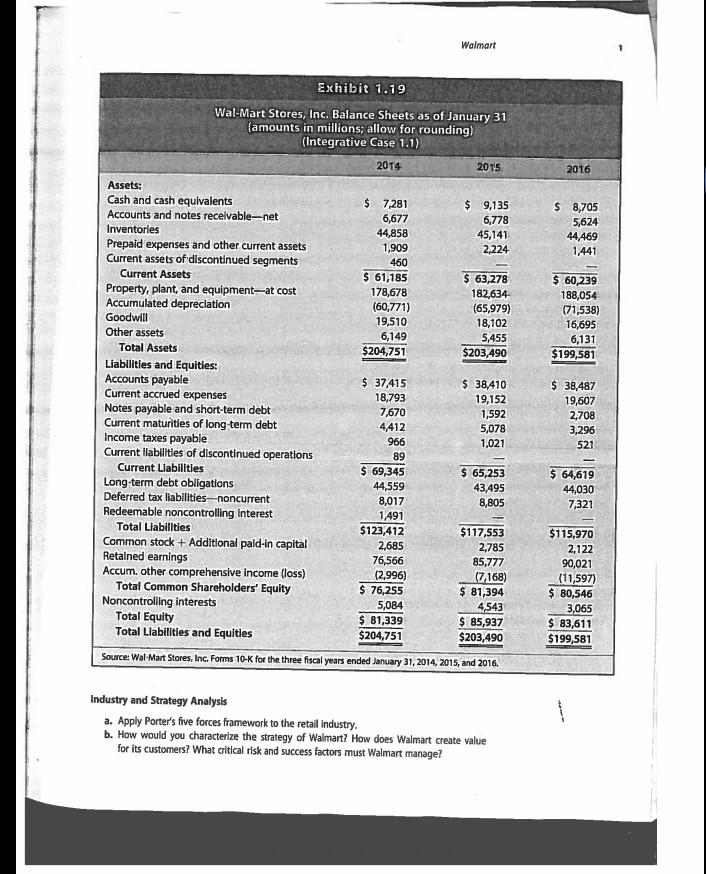
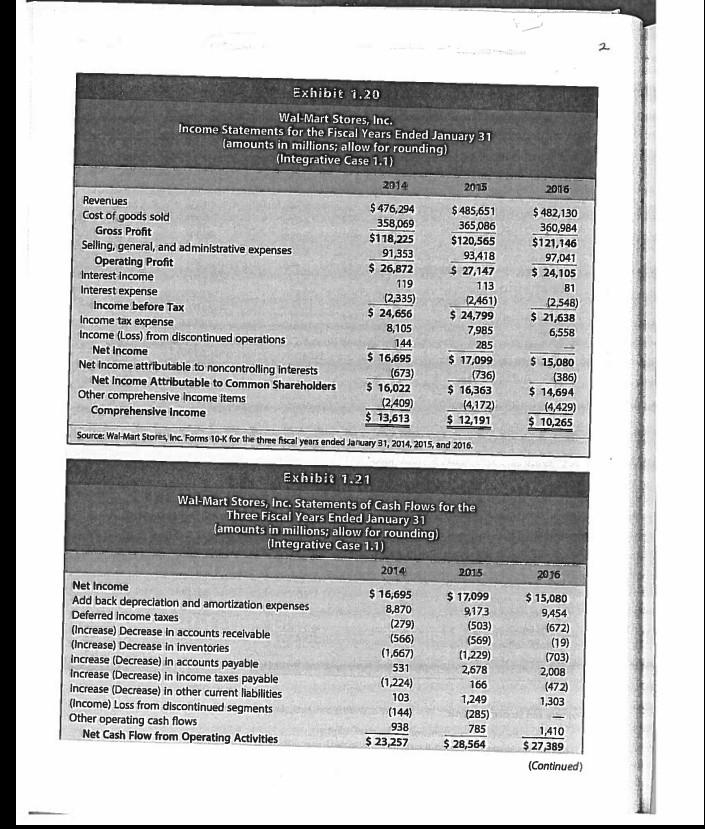
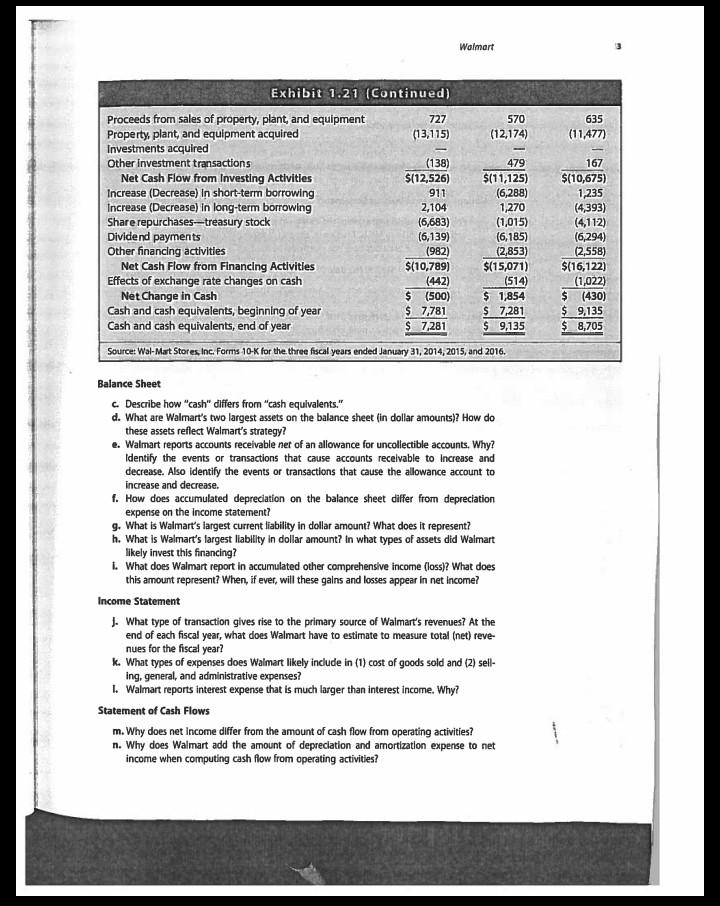
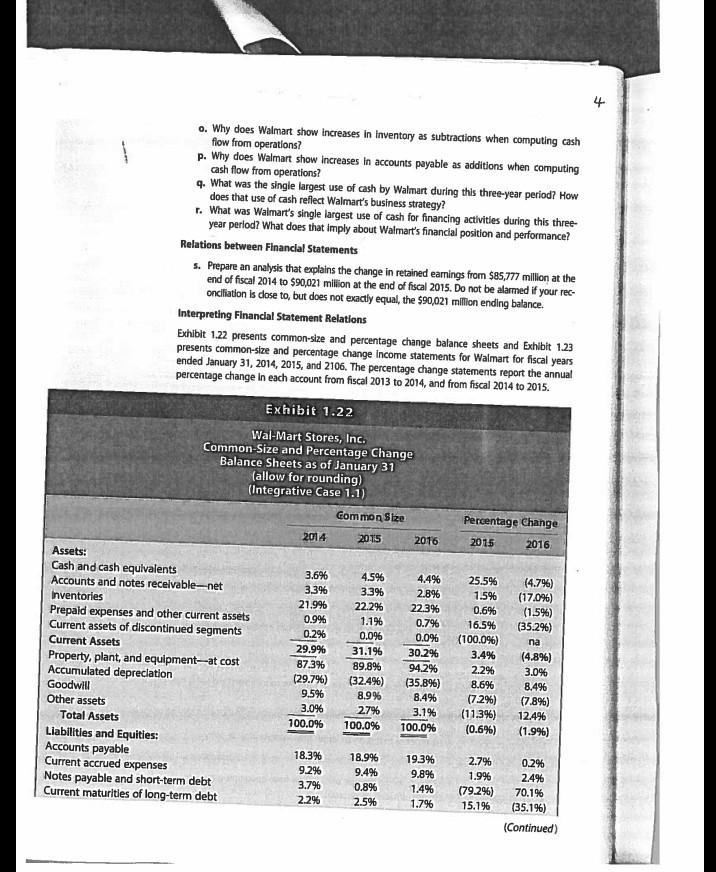
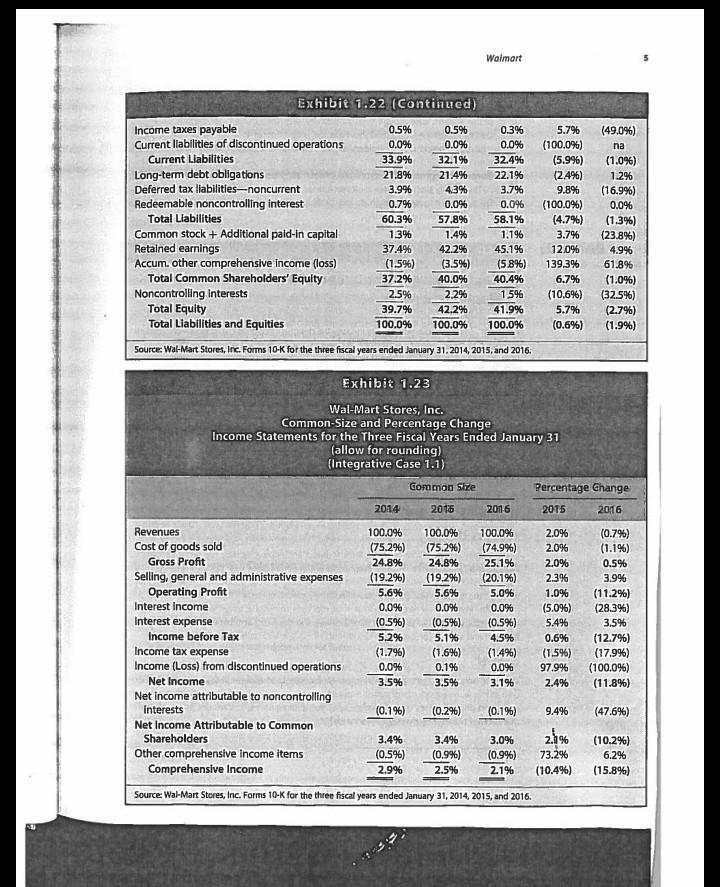
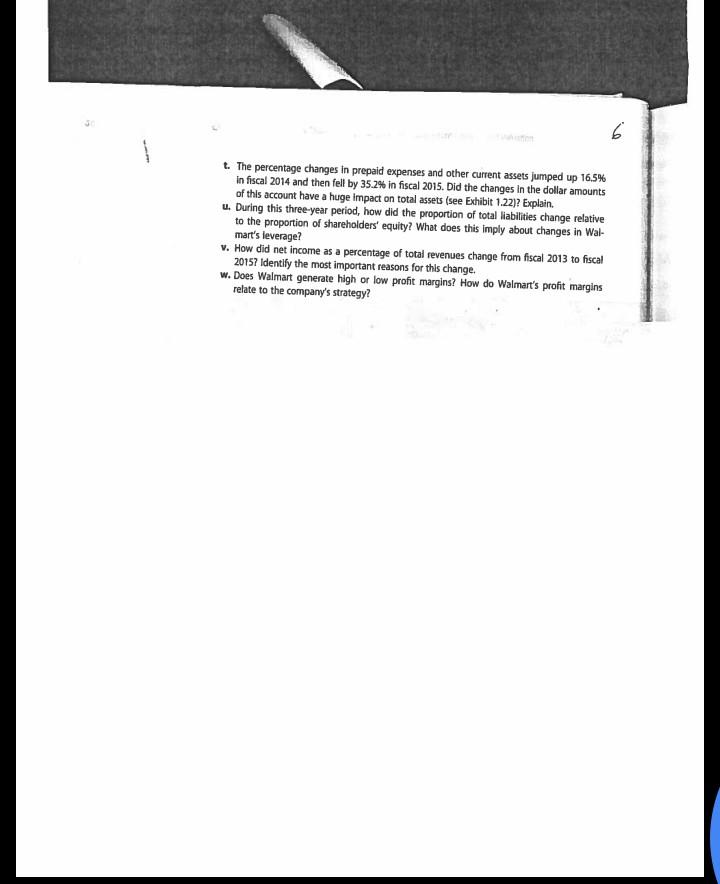
The first case at the end of this chapter and numerous subsequent chapters is a series of integrative cases involving Wal-Mart Stores, Inc. (Walmart). The series of cases applies the concepts and analytical toots discussed in each chapter to Walmart's financial statements and notes. The prepara tion of responses to the questions in these cases results in an integrated illustration of the six se quential steps in financial statement analysis discussed in this chapter and thwoughout the book Introduction Walmart is a very large chain of retail stores seling consumer goods. As it states in its Form 10- K for fiscal 2015: Wal-Mart Stores, Inc. ("Walmart," the "Company" or "we) helps people around the world save money and live better-anytime and anywhere-in retail stores or through our e-commerce and mobile capabilities. Through innovation, we are striving to create a customer-centrkc experience that seamlessly integrates digital and physical shopping. Physical retail encompasses our brick and mortar presence in each market where we operate. Digital retail is comprised of our e-commerce websites and mobile commerce applications Each week, we serve nearly 260 million customers who visit our over 11,500 stores under 63 banners in 28 countries and e-commerce websites in 11 ocountries. Our strategy is to lead on price, differentlate on access, be competitive on assort- ment and deliver a great experience. Leading on price is designed to earn the trust of our customers every day by providing a broad assortment of quality merchandise and services at everyday low prices ("EDLP"). EDLP Is our pricing philosophy under which we price items at a low price every day so our customers trust that our prices will not change under frequent promotional activity. Price leadership is core to who we are. Everyday low cost ("EDLC") is our commitment to control expenses so those cost sav- ings can be passed along to our customers. Our digital and physical presence provides customers access to our broad assortment anytime and anywhere. We strive to give our customers and members a great digital and physical shopping experience. For more detalled discussion of Walmart's stores, products, customers, and business model, visit the company's website www.corporate.walmart.com." Financial Statements Exhibit 1.19 presents comparative balance sheets, Exhibit 1.20 presents comparative Income statements, and Exhibit 1.21 (pages 62-63) presents comparative statements of cash flows for Walmart for the three fiscal years ending January 31, 2014, 2015, and 2016. Walmart prepares its financial statements in accordance with US. GAAP. For more detall on Walmart financial statements, or to download the fiscal 2015 Form 10-K, you can visit Walmart's investor relations page: www.stockwalmart.com/investors/default.aspx." REQUIRED Respond to the following questions relating to Walmart. "Whle more information on Waimart's buninesas may be helpful, it is net necensary to complete this case. "While information on the investor relations page may be helpful, it is not necessary to complete this case Walmart Exhibit 1.19 Wal-Mart Stores, Inc. Balance Sheets as of January 31 (amounts in millions; allow for rounding) (Integrative Case 1.1) 2014 2015 2016 Assets: Cash and cash equivalents Accounts and notes receivable-net $ 7,281 $ 9,135 $ 8,705 5,624 44,469 1441 6,677 6,778 Inventories 44,858 Prepaid expenses and other current assets Current assets of discontinued segments 45,141 2,224 1,909 460 Current Assets $ 61,185 $ 63,278 $ 60,239 Property, plant, and equipment-at cost Accumulated depreciation 178,678 (60,771) 19,510 6,149 $204,751 182,634 (65,979) 188,054 (71,538) 16,695 Goodwll 18,102 Other assets 5,455 $203,490 6,131 $199,581 Total Assets Liablities and Equities: Accounts payable Current accrued expenses Notes payable and short-term debt Current maturities of long term debt Income taxes payable Current llabilities of discontinued operations Current Liabilities Long-term debt obligations Deferred tax liabilities-noncurrent Redeemable noncontrolling Interest $ 37,415 $ 38,410 $ 38,487 19,607 18,793 7,670 19,152 1,592 2,708 4,412 5,078 3,296 966 1,021 521 89 $ 69,345 $ 65,253 $ 64,619 44,559 43,495 8,805 44,030 8,017 7,321 1,491 $123,412 2,685 76,566 (2,996) $ 76,255 Total Llabilities $117,553 $115,970 Common stock + Additional pald-in capital Retained earnings Accum. other comprehensive income (loss) Total Common Shareholders' Equity Noncontrolling interests Total Equity Total Liabilities and Equities 2,785 85,777 (7,168) $ 81,394 4,543 $ 85,937 $203,490 2,122 90,021 (11,597) $ 80,546 3,065 $ 83,611 5,084 $ 81,339 $204,751 $199,581 Source: Wal-Mart Stores, Inc. Forms 10-K for the three fiscal years ended January 31, 2014, 2015, and 2016. Industry and Strategy Analysis a. Apply Porter's five forces framework to the retail industry. b. How would you characterize the strategy of Walmart? How does Walmart create value for its customers? What citical risk and success factors must Walmart manage? 2 Exhibit 1.20 Wal-Mart Stores, Inc. Income Statements for the Fiscal Years Ended January 31 (amounts in millions; allow for rounding) (Integrative Case 1.1) 2014 2015 2016 Revenues Cost of goods sold Gross Profit Selling, general, and administrative expenses Operating Profit Interest income $476,294 358,069 $118,225 91,353 $ 26,872 $ 485,651 365,086 $120,565 $ 482,130 360,984 $121,146 97,041 $ 24,105 93,418 $ 27,147 119 113 81 Interest expense Income before Tax Income tax exxpense Income (Loss) from discontinued operations Net Income Net Income attributable to noncontrolling Interests (2,335) $ 24,656 2461) $ 24,799 (2,548) $ 21,638 8,105 7,985 6,558 144 285 $ 17,099 (736) $ 16,363 (4,172) $ 12,191 Source: Wal-Mart Stores, Inc. Forms 10-K for the three fiscal years ended January 31, 2014, 2015, and 2016. $ 16,695 (673) $ 16,022 (2409) $ 13,613 $ 15,080 (386) $ 14,694 (4,429) $ 10,265 Net Income Attributable to Common Shareholders Other comprehensive Income items Comprehensive Income Exhibit 1.21 Wal-Mart Stores, Inc. Statements of Cash Flows for the Three Fiscal Years Ended January 31 (amounts in millions; allow for rounding) (Integrative Case 1.1) 2014 2015 2016 Net Income Add back depreciation and amortization expenses Deferred Income taxes (Increase) Decrease in accounts receivable (Increase) Decrease in inventories Increase (Decrease) in accounts payable Increase (Decrease) in Income taxes payable Increase (Decrease) in other current llabilities (Income) Loss from discontinued segments Other operating cash flows Net Cash Flow from Operating Activities $ 16,695 $ 17,099 9,173 (503) (569) (1,229) 2,678 $ 15,080 8,870 9,454 (279) (672) (19) (703) 2,008 (472) 1,303 (566) (1,667) 531 (1,224) 166 103 1,249 (285) (144) 938 785 1,410 $ 23,257 $ 28,564 $ 27,389 (Continued) Walmart Exhibit 1.21 (Continued) Proceeds from sales of property, plant, and equipment Property, plant, and equipment acquired Investments acqulred Other investment transactions Net Cash Flow from Investing Activities Increase (Decrease) in short-term borrowing Increase (Decrease) in long-term borrowing Share repurchases-treasury stock Dividend payments Other financing activitles Net Cash Flow from Financing Activities Effects of exchange rate changes on cash Net Change in Cash Cash and cash equivalents, beginning of year Cash and cash equivalents, end of year 727 570 635 (13,115) (12,174) (11,477) (138) $(12,526) 479 167 $(11,125) (6,288) 1,270 (1,015) (6,185) (2,853) $(15,071) $(10,675) 1,235 (4,393) (4,112) (6,294) (2,558) $(16,122) (1,022) $ (430) $ 9,135 $ 8,705 911 2,104 (6,683) (6,139) (982) $(10,789) (442) $ (500) $ 7,781 $ 7,281 (514) $ 1,854 $ 7,281 $ 9,135 Source: Wal-Mart Stores Inc. Forms 10-K for the three fiscal years ended January 31, 2014, 2015, and 2016. Balance Sheet c. Describe how "cash" differs from "cash equivalents." d. What are Walmart's two largest assets on the balance sheet (in dollar amounts)? How do these assets reflect Walmart's strategy? e. Walmart reports accounts receivable net of an allowance for uncollectible accounts. Why? Identify the events or transactions that cause accounts receivable to Increase and decrease. Also identify the events or transactions that cause the allowance account to increase and decrease. f. How does accumulated depreciation on the balance sheet differ from depreciation expense on the income statement? g. What is Walmart's largest current liability in dollar amount? What does it represent? h. What is Walmart's largest lablity in dollar amount? in what types of assets did Walmart likely invest this financing? i. What does Walmart report in accumulated other comprehensive income (loss)? What does this amount represent? When, if ever, will these galns and losses appear in net income? Income Statement J. What type of transaction gives rise to the primary source of Walmart's revenues? At the end of each fiscal year, what does Walmart have to estimate to measure total (net) reve- nues for the fiscal year? k. What types of expenses does Walmart likely include in (1) cost of goods sold and (2) sell- ing, general, and administrative expenses? 1. Walmart reports interest expense that is much larger than interest income. Why? Statement of Cash Flows m. Why does net Income differ from the amount of cash flow from operating activities? n. Why does Walmart add the amount of depreclation and amortization expense to net income when computing cash flow from operating activities? 4 o. Why does Walmart show increases in inventory as subtractions when computing cash flow from operations? p. Why does Walmart show increases In accounts payable as additions when computing cash flow from operations? q. What was the single largest use of cash by Walmart during this three-year period? How does that use of cash reflect Walmart's business strategy? r. What was Waimart's single largest use of cash for financing activities during this three- year perlod? What does that imply about Walmart's financial position and performance? Relations between Financial Statements s. Prepare an analysis that explains the change in retained eamings from $85,777 million at the end of fiscal 2014 to $90,021 milion at the end of fiscal 2015. Do not be alarmed if your rec- oncliation is dose to, but does not exactly equal, the $90,021 million ending balance. Interpreting Financlal Statement Relations Exhibit 1.22 presents common-size and percentage change balance sheets and Exhibit 1.23 presents common-size and percentage change income statements for Walmart for fiscal years ended January 31, 2014, 2015, and 2106. The percentage change statements report the annual percentage change in each account from fiscal 2013 to 2014, and from fiscal 2014 to 2015. Exhibit 1.22 Wal-Mart Stores, Inc. Common Size and Percentage Change Balance Sheets as of January 31 (allow for rounding) (Integrative Case 1.1) Common Size Percentage Change 2014 2015 2016 2015 2016 Assets: Cash and cash equivalents Accounts and notes receivable-net 3.6% 4.5% 4.4% 2.8% 25.5% (4.7%) (17.096) (1.5%) (35.2%) 33% 3.3% 1.5% nventories 21.9% 22.2% 22.3% 0.6% Prepaid expenses and other current assets Current assets of discontinued segments 0.9% 1.1% 0.7% 16.5% 0.2% 0.0% 0.0% (100.0%) 3.4% na Current Assets 29.9% 87.3% (29.7%) 9.5% 31.1% 30.2% (4.8%) 3.0% Property, plant, and equipment-at cost Accumulated depreclation Goodwill Other assets Total Assets 89.8% 94.2% 2.2% (32.4%) 8.9% (35.8%) 8.6% 8.4% 8.4% (7.2%) (7.8%) 3.0% 27% (113%) (0.6%) 3.1% 12.4% 100.0% 100.0% 100.0% (1.9%) Liabilities and Equities: Accounts payable Current accrued expenses Notes payable and short-term debt Current maturities of long-term debt 18.3% 18.9% 9.4% 2.7% 1,9% 193% 0.2% 9.2% 9.8% 2.4% 0.8% 2.5% 3.79% 1.4% (79.2%) 15.1% 70.1% 2.2% 1.7% (35.19%) (Continued) Waimart Exhibit 1.22 (Continued) Income taxes payable Current llabilities of discontinued operations Current Liabilities 0.5% 0.5% 0.3% 5.7% (49.0%) 0.0% 0.0% 0.0% (100.0%) (5.9%) (2.4%) na 33.9% 32.1% 32.4% (1.0%) Long-term debt obligations Deferred tax liabilities-noncurrent Redeemable noncontrolling interest 21.8% 21.4% 22.1% 1.2% 3.9% 4.3% 3.7% 9.8% (16.9%) (100.0%) (4.7%) 0.7% 0.0% 0.0% 0.0% Total Liabilities 60.3% 57.8% 58.1% (1,3%) (23.8%) Common stock + Additional paid-in capital Retained earnings Accum. other comprehensive income (loss) Total Common Shareholders' Equity Noncontrolling interests Total Equity Total Liabilities and Equities 13% 1.4% 1.1% 3.7% 37.4% 42.2% 45.1% 12.0% 4.9% (1.5%) (3.5%) (58%) 139.3% 61.8% 37.2% 40.0% 40.4% 6.7% (1.0%) (32.5%) (2.7%) 2.5% 2.2% 15% (10.6%) 39.7% 42.2% 41.9% 5.7% 100.0% 100.0% 100.0% (0.6%) (1.9%) Source: Wal-Mart Stores, Inc. Forms 10-K for the three fiscal years ended January 31, 2014, 2015, and 2016. Exhibit 1.23 Wal-Mart Stores, Inc. Common-Size and Percentage Change Income Statements for the Three Fiscal Years Ended January 31 (allow for rounding) (Integrative Case 1.1) Gommon Size Percentage Ghange 2014 2015 2016 2015 2016 Revenues 100.0% (75.2%) (0.7%) (1.1%) 100.0% 100.0% 2.0% Cost of goods sold (75.2%) (74.9%) 2.0% Gross Profit 24.8% 24.8% 25.1% 2.0% 0.5% Selling, general and administrative expenses Operating Profit (19.2%) (19.2%) 5.6% (20.1%) 2.3% 3.9% 5.6% (11.2%) (28.3%) 5.0% 1.0% Interest Income 0.0% 0.0% 0.0% (5.0%) Interest expense (0.5%) (0.5%) (0.5%) 5.4% 3.5% Income before Tax 5.2% 5.1% 4.5% (12.7%) (17.9%) (100.0%) (11.8%) 0.6% Income tax expense Income (Loss) from discontinued operations (1.7%) (1.6%) (1.4%) (1.5%) 0.0% 0.1% 0.0% 97.9% Net Income 3.5% 3.5% 3.1% 2.4% Net income attributable to noncontrolling interests (0.196) (0.296) (0.1%) 9.4% (47.6%) Net Income Attributable to Common Shareholders 2.1% 3.4% 3.4% 3.0% (10.2%) Other comprehensive income items Comprehensive Income (0.5%) (0.9%) (0.9%) 73.2% 6.2% 2,9% 2.5% 2.1% (10.4%) (15.8%) Source: Wal-Mart Stores, Inc. Forms 10-K for the three fiscal years ended January 31, 2014, 2015, and 2016. t. The percentage changes in prepaid expenses and other current assets jumped up 16.5% in fiscal 2014 and then fell by 35.2% in fiscal 2015. Did the changes in the dollar amounts of this account have a huge impact on total assets (see Exhibit 1.22)? Explain. u. During this three-year period, how did the proportion of total liabilities change relative to the proportion of shareholders' equity? What does this imply about changes in Wal- mart's leverage? v. How did net income as a percentage of total revenues change fram fiscal 2013 to fiscal 20157 Identify the most important reasons for this change. w. Does Walmart generate high or low profit margins? How do Walmart's profit margins relate to the company's strategy?
Step by Step Solution
3.59 Rating (152 Votes )
There are 3 Steps involved in it
Answer 1 Teaching Strategy We have taught this case with two approaches If an opportunity exists to distribute the case prior to the first class we give students the solutions to the questions involvi... View full answer

Get step-by-step solutions from verified subject matter experts