

Question: The first diagram below shows data for the interest rate on 10-year bonds issued by the U.S. Treasury (i.e., the U.S. Government) from 2000 to

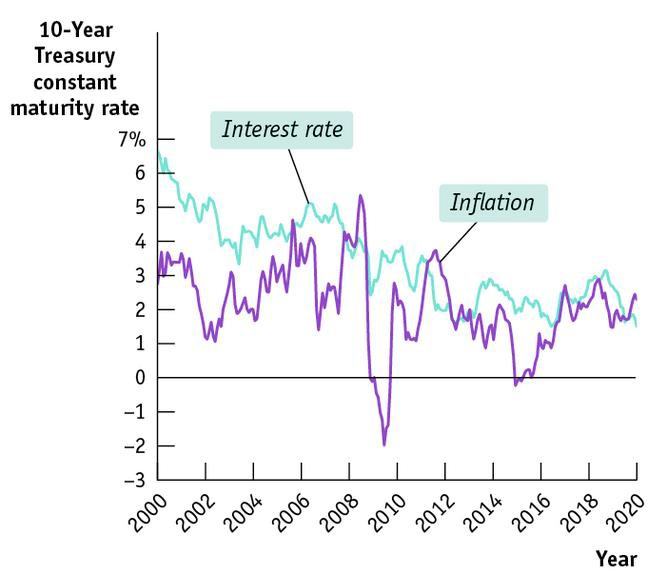
The first diagram below shows data for the interest rate on 10-year bonds issued by the U.S. Treasury (i.e., the U.S. Government) from 2000 to 2020. Furthermore, the diagram includes the inflation rate experienced in the U.S. from 2000 to 2020. a. How would you describe the relationship between the two?
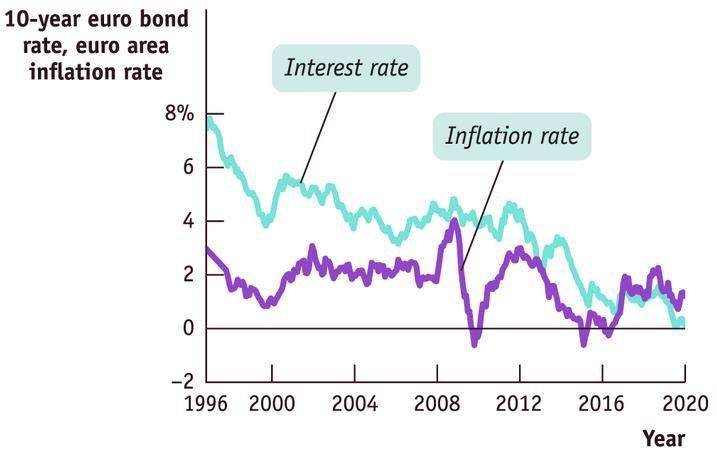
\f10-year euro bond rate, euro area inflation rate Interest rate 8% Inflation rate 6 4 ON -2 1996 2000 2004 2008 2012 2016 2020 Year
Step by Step Solution
There are 3 Steps involved in it
1 Expert Approved Answer
Step: 1 Unlock

Question Has Been Solved by an Expert!
Get step-by-step solutions from verified subject matter experts
Step: 2 Unlock
Step: 3 Unlock