

Question: the first five pictures are finacial statements. the second two are what i am needing, the ratio analysis. G 2017 2018 D 2019 E 2020
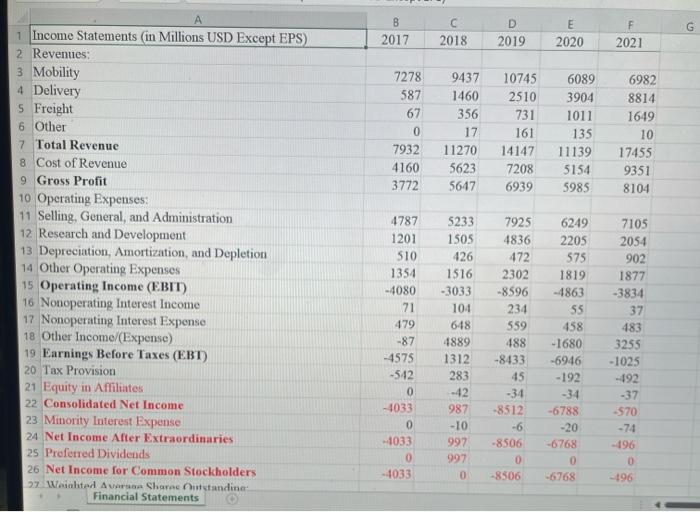
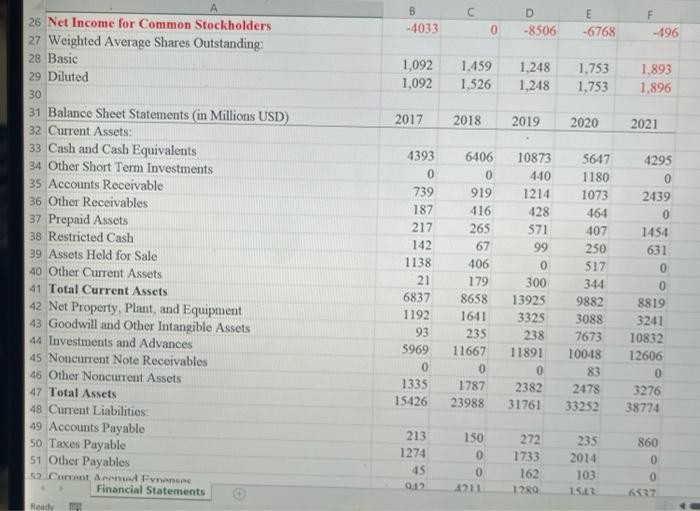
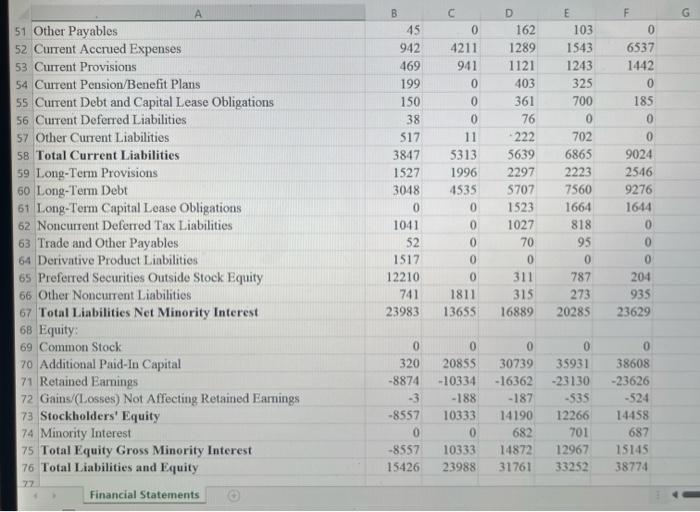
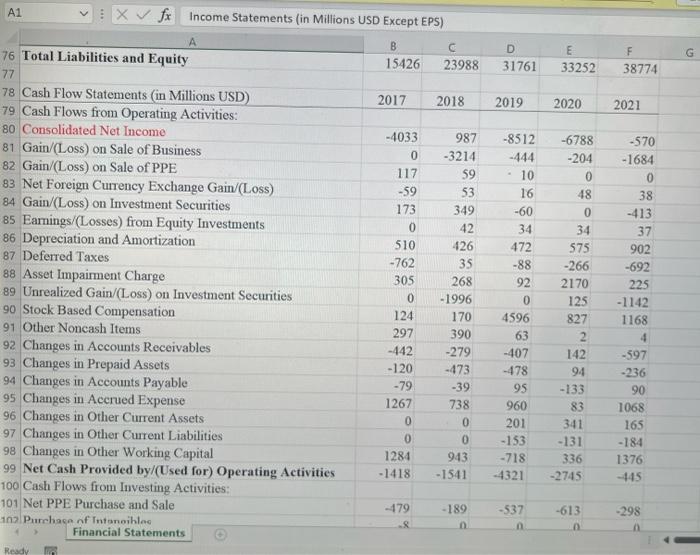
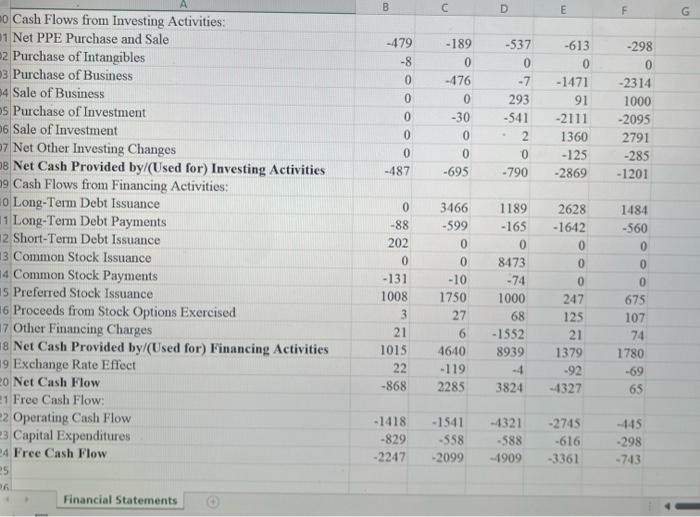
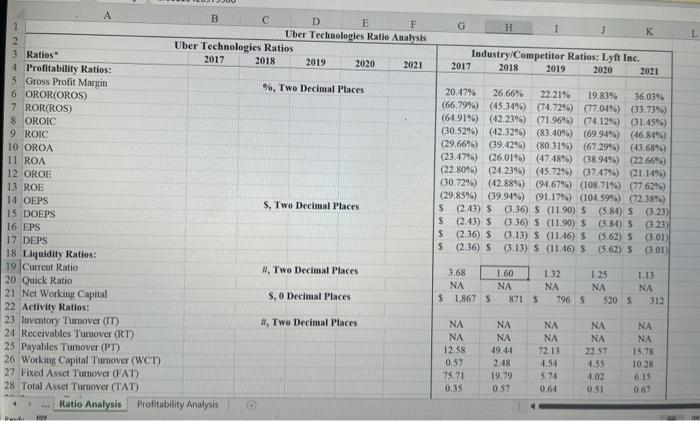
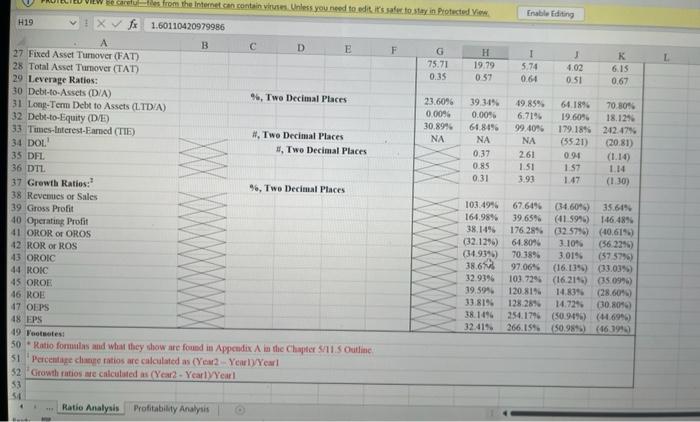
G 2017 2018 D 2019 E 2020 F 2021 7278 587 67 0 7932 4160 3772 9437 1460 356 17 11270 5623 5647 10745 2510 731 161 14147 7208 6939 6089 3904 1011 135 11139 5154 5985 6982 8814 1649 10 17455 9351 8104 1 Income Statements (in Millions USD Except EPS) 2 Revenues 3 Mobility 4 Delivery 5 Freight 6 Other 7 Total Revenue 8 Cost of Revenue 9 Gross Profit 10 Operating Expenses: 11 Selling, General, and Administration 12 Research and Development 13 Depreciation, Amortization, and Depletion 14 Other Operating Expenses 15 Operating Income (EBIT) 16 Nonoperating Interest Income 17 Nonoperating Interest Expense 18 Other Income/(Expense) 19 Earnings Before Taxes (EBT) 20 Tax Provision 21 Equity in Affiliates 22 Consolidated Net Income 23 Minority Interest Expense 24 Net Income After Extraordinaries 25 Proforred Dividends 26 Net Income for Common Stockholders 27 Wanted Aur Sharee Outstandine Financial Statements 7925 4836 472 2302 -8596 234 559 4787 1201 510 1354 -4080 71 479 -87 -4575 -542 0 -4033 0 -1033 0 - 4033 5233 1505 426 1516 -3033 104 648 4889 1312 283 -42 987 -10 997 997 0 488 6249 2205 575 1819 -4863 55 458 -1680 -6946 -192 -34 -6788 -20 -6768 0 -6768 7105 2054 902 1877 -3834 37 483 3255 -1025 -192 -37 $70 -74 -196 0 -196 -8433 45 -34 -8512 -6 -8506 0 -8506 C B -4033 D -8506 0 E -6768 F -196 1,092 1,092 1.459 1,526 1.248 1,248 1,753 1,753 1,893 1.896 2017 2018 2019 2020 2021 4295 0 2439 0 1454 26 Net Income for Common Stockholders 27 Weighted Average Shares Outstanding: 28 Basic 29 Diluted 30 31 Balance Sheet Statements (in Millions USD) 32 Current Assets: 33 Cash and Cash Equivalents 34 Other Short Term Investments 35 Accounts Receivable 36 Other Receivables 37 Prepaid Assets 38 Restricted Cash 39 Assets Held for Sale 40 Other Current Assets 41 Total Current Assets 42 Net Property, Plant, and Equipment 43 Goodwill and Other Intangible Assets 44 Investments and Advances 45 Noncurrent Note Receivables 46 Other Noncurrent Assets 47 Total Assets 48 Current Liabilities: 49 Accounts Payable 50 Taxes Payable 51 Other Payables 52 Current And Finance Financial Statements 631 4393 0 739 187 217 142 1138 21 6837 1192 93 5969 0 1335 15426 6406 0 919 416 265 67 406 179 8658 1641 235 11667 0 1787 23988 10873 440 1214 428 571 99 0 300 13925 3325 238 11891 0 2382 31761 5647 1180 1073 464 407 250 517 344 9882 3088 7673 10048 83 2478 33252 0 0 8819 3241 10832 12606 0 3276 38774 213 1274 45 0.12 150 0 0 4211 272 1733 162 1989 235 2014 103 15 860 0 0 6537 Ready GO c G 0 51 Other Payables 52 Current Accrued Expenses 53 Current Provisions 54 Current Pension/Benefit Plans 55 Current Debt and Capital Lease Obligations 56 Current Deferred Liabilities 57 Other Current Liabilities 58 Total Current Liabilities 59 Long-Term Provisions 60 Long-Term Debt 61 Long-Term Capital Lease Obligations 62 Noncurrent Deferred Tax Liabilities 63 Trade and Other Payables 64 Derivative Product Liabilities 65 Preferred Securities Outside Stock Equity 66 Other Noncurrent Liabilities 67 Total Liabilities Net Minority Interest 68 Equity 69 Common Stock 70 Additional Paid-In Capital 71 Retained Earnings 72 Gains/(Losses) Not Affecting Retained Earnings 73 Stockholders' Equity 74 Minority Interest 75 Total Equity Gross Minority Interest 76 Total Liabilities and Equity B 45 942 469 199 150 38 517 3847 1527 3048 0 1041 52 1517 12210 741 23983 4211 941 0 0 0 11 5313 1996 4535 0 0 0 0 0 1811 13655 D 162 1289 1121 403 361 76 - 222 5639 2297 5707 1523 1027 70 0 311 315 16889 E 103 1543 1243 325 700 0 702 6865 2223 7560 1664 818 95 0 787 273 20285 F 0 6537 1442 0 185 0 0 9024 2546 9276 1644 0 0 0 204 935 23629 0 320 -8874 - 3 -8557 0 -8557 15426 0 20855 -10334 -188 10333 0 10333 23988 0 30739 - 16362 -187 14190 682 14872 31761 35931 -23130 -535 12266 701 12967 33252 0 38608 -23626 -524 14458 687 15145 38774 27 Financial Statements D 31761 E 33252 F 38774 2019 2020 2021 A1 Xv fx Income Statements (in Millions USD Except EPS) B C 76 Total Liabilities and Equity 15426 23988 77 78 Cash Flow Statements (in Millions USD) 2017 2018 79 Cash Flows from Operating Activities: 80 Consolidated Net Income -4033 987 81 Gain/(Loss) on Sale of Business 0 -3214 82 Gain/(Loss) on Sale of PPE 117 59 83 Net Foreign Currency Exchange Gain/(Loss) -59 53 84 Gain/(Loss) on Investment Securities 173 349 85 Earnings/(Losses) from Equity Investments 0 42 86 Depreciation and Amortization 510 126 87 Deferred Taxes -762 35 88 Asset Impairment Charge 305 268 89 Unrealized Gain/(Loss) on Investment Securities 0 -1996 90 Stock Based Compensation 124 170 91 Other Noncash Items 297 390 92 Changes in Accounts Receivables -442 -279 93 Changes in Prepaid Assets -120 -473 94 Changes in Accounts Payable -79 -39 95 Changes in Accrued Expense 1267 738 96 Changes in Other Current Assets 0 0 97 Changes in Other Current Liabilities 0 0 98 Changes in Other Working Capital 1284 943 99 Net Cash Provided by/(Used for) Operating Activities -1418 -1541 100 Cash Flows from Investing Activities: 101 Net PPE Purchase and Sale -479 -189 102 Purchase of Intangibles Financial Statements -8512 -444 - 10 16 -60 34 472 -88 92 0 4596 63 -407 -478 95 960 201 -153 -718 -4321 -6788 -204 0 48 0 34 575 -266 2170 125 827 2 142 94 -133 83 341 -131 336 -2745 -570 -1684 0 38 -413 37 902 -692 225 -1142 1168 4 -597 -236 90 1068 165 -184 1376 -145 -537 -613 -298 Ready B D E F G -479 -8 0 0 0 0 0 -487 -189 0 -476 0 -30 0 0 -695 -537 0 -7 293 -541 2 0 - 790 -613 0 -1471 91 -2111 1360 -125 -2869 -298 0 -2314 1000 -2095 2791 -285 -1201 mo Cash Flows from Investing Activities: 1 Net PPE Purchase and Sale 2 Purchase of Intangibles 3 Purchase of Business 94 Sale of Business s Purchase of Investment 6 Sale of Investment 7 Net Other Investing Changes 8 Net Cash Provided by/(Used for) Investing Activities 99 Cash Flows from Financing Activities: 0 Long-Term Debt Issuance 11 Long-Term Debt Payments 2 Short-Term Debt Issuance 13 Common Stock Issuance 14 Common Stock Payments 15 Preferred Stock Issuance 16 Proceeds from Stock Options Exercised 17 Other Financing Charges 18 Net Cash Provided by/(Used for) Financing Activities 19 Exchange Rate Effect 20 Net Cash Flow 21 Free Cash Flow: 22 Operating Cash Flow 23 Capital Expenditures 24 Free Cash Flow 5 2628 -1642 0 0 0 -88 202 0 - 131 1008 3 21 1015 22 -868 3466 -599 0 0 -10 1750 27 6 4640 -119 2285 1189 -165 0 8473 -74 1000 68 -1552 8939 -4 3824 0 247 125 21 1379 -92 -4327 1484 -560 0 0 0 675 107 74 1780 -69 65 -1418 -829 -2247 -1541 -558 -2099 -4321 -588 -4909 -2745 -616 -3361 -145 -298 -743 06 Financial Statements G H 1 Industry/Competitor Ratios: Lyft Inc. 2017 2018 2019 2020 2021 A B D E F 1 Uber Technologies Ratio Analysis Uber Technologies Ratios 3 Ratios 2017 2018 2019 2020 2021 4 Profitability Ratios: 5 Gross Profit Margin %, Two Decimal Places 6 OROR(OROS) 7 ROR(ROS) 8 OROIC 9 ROIC 10 OROA 11 ROA 12 OROE 13 ROE 14 OEPS S, Two Decimal Places 15 DOEPS 16 EPS 17 DEPS 18 Liquidity Ratios: 19 Current Ratio 8. Two Decimal Places 20 Quick Ratio 21 Net Working Capital S. O Decimal Places 22 Activity Ratios: 23 Inventory Turnover (IT) # Two Decimal Places 24 Receivables Turnover (RT) 25 Payables Tumover (PT) 26 Working Capital Turnover (WCT) 27 Fixed Asset Turnover (FAT) 28 Total Asset Turnover (TAT) 1. Ratio Analysis Profitability Analysis 20.47% 26.66% 22.21% 19,83% 36,03% (66.79%) (45.34%) (74.72) (7704%) (33.7396) (64.91%) (12.23%) (71.96%) (74.1296) (31.45%) (30.52%) (42.3296) (83.40%) (69 94%) (46,81%) (29.66%) (39.42%) (80.31%) (67.29%) (43.68%) (23.47%) (26.019) (47.4896) (38.94%) (22.6695) (22.80%) (24.23%) (45.72%) (37.479) (21.14%) (30.72%) (42.889) (94.67%) (108.719) (17.62%) (29.85%) (39.949) (91.17%) (104.599) (723876) $ (2.43) S (3.36) S (11.90) S (5.84) S (23) $ (2.43) S (3.36) S (1190) S (5.84) $ $ (2.36) S (3.13) S (1146) S (5.62) S (3.01 $ (236) S (313) S (11.46) S (5.62) S (301) (3.23) 3,68 NA $ 1,867 S 1.60 NA 8715 1.32 NA 7965 1.25 NA 520 $ 113 NA 312 NA NA 12.58 0,57 75 71 0.35 NA NA 49.44 2.18 19.79 0.57 NA NA 72.13 4,54 5.74 0.61 NA NA 22.57 4.35 102 051 NA NA 15.78 10:28 6.15 0.67 WILW Be Carefules from the Internet con contains Unless you need to edit it's safe to stay in Protected View Enable Editing F G 75.71 0.35 H 19.79 0:57 1 5.74 0.64 4.02 0.51 K 6.15 0.67 23.6096 0.0096 30.8996 NA 39 34% 0.00% 61.84% NA 0.37 0.85 0.31 19.85% 6.719 99 40% NA 2.61 1.51 3.93 64.1895 19.6096 179.1895 (5521) 0.91 1:57 1.47 70 80% 18.124 242.47% (20.81) (1.14) 114 (130) H19 1.60110420979986 B D E 27 Fixed Asset Turnover (FAT) 28 Total Asset Turnover (TAT) 29 Leverage Ratios: 30 Debt-to-Assets (D/A) 96, Two Decimal Places 31 Long-Term Debt to Assets (LTDA) 32 Debt-to-Equity (DE) 33 Times Interest-Eamed (TTE) # Two Decimal Places 34 DOL #. Two Decimal Places 35 DFL 36 DTL 37 Growth Ratios: 96, Two Decimal Places 38 Revenues or Sales 39 Gross Profit 40 Operating Profit 41 OROR OR OROS 42 ROR or ROS 43 OROIC 44 ROIC 45 OROE 46 ROE 17 OEPS 18 EPS 19 Fototes 50 Ratio form and what they show are found in Appendix A in the Chapter 11 S Outline S1 Percentage che ratios are calculated as (2 Yearly Year! 52 Growth ratione calculated as (Year 2-Yearly 53 5 Ratio Analysis Profitability Analysis 103.4946 164.98% 38.1496 (32.1296) (34.9395 38.6 32.9396 19.5946 33.819 38.1096 32.41% 67.60% (34.60%) 35 645 39.65% (41 599) 146.489 176 284 (32.57%) (40.619) 64.80% 3:10 (56.2255) 70.38% 3.019 (57 57%) 97.06% (16.035) (13.03%) 100.729 (16.214) 05 099) 120.8194 14839 (28.604 128289 14.729 (30.80) 254.17% (50.949) (14.699) 266.19% (50.989) (46.1996) G 2017 2018 D 2019 E 2020 F 2021 7278 587 67 0 7932 4160 3772 9437 1460 356 17 11270 5623 5647 10745 2510 731 161 14147 7208 6939 6089 3904 1011 135 11139 5154 5985 6982 8814 1649 10 17455 9351 8104 1 Income Statements (in Millions USD Except EPS) 2 Revenues 3 Mobility 4 Delivery 5 Freight 6 Other 7 Total Revenue 8 Cost of Revenue 9 Gross Profit 10 Operating Expenses: 11 Selling, General, and Administration 12 Research and Development 13 Depreciation, Amortization, and Depletion 14 Other Operating Expenses 15 Operating Income (EBIT) 16 Nonoperating Interest Income 17 Nonoperating Interest Expense 18 Other Income/(Expense) 19 Earnings Before Taxes (EBT) 20 Tax Provision 21 Equity in Affiliates 22 Consolidated Net Income 23 Minority Interest Expense 24 Net Income After Extraordinaries 25 Proforred Dividends 26 Net Income for Common Stockholders 27 Wanted Aur Sharee Outstandine Financial Statements 7925 4836 472 2302 -8596 234 559 4787 1201 510 1354 -4080 71 479 -87 -4575 -542 0 -4033 0 -1033 0 - 4033 5233 1505 426 1516 -3033 104 648 4889 1312 283 -42 987 -10 997 997 0 488 6249 2205 575 1819 -4863 55 458 -1680 -6946 -192 -34 -6788 -20 -6768 0 -6768 7105 2054 902 1877 -3834 37 483 3255 -1025 -192 -37 $70 -74 -196 0 -196 -8433 45 -34 -8512 -6 -8506 0 -8506 C B -4033 D -8506 0 E -6768 F -196 1,092 1,092 1.459 1,526 1.248 1,248 1,753 1,753 1,893 1.896 2017 2018 2019 2020 2021 4295 0 2439 0 1454 26 Net Income for Common Stockholders 27 Weighted Average Shares Outstanding: 28 Basic 29 Diluted 30 31 Balance Sheet Statements (in Millions USD) 32 Current Assets: 33 Cash and Cash Equivalents 34 Other Short Term Investments 35 Accounts Receivable 36 Other Receivables 37 Prepaid Assets 38 Restricted Cash 39 Assets Held for Sale 40 Other Current Assets 41 Total Current Assets 42 Net Property, Plant, and Equipment 43 Goodwill and Other Intangible Assets 44 Investments and Advances 45 Noncurrent Note Receivables 46 Other Noncurrent Assets 47 Total Assets 48 Current Liabilities: 49 Accounts Payable 50 Taxes Payable 51 Other Payables 52 Current And Finance Financial Statements 631 4393 0 739 187 217 142 1138 21 6837 1192 93 5969 0 1335 15426 6406 0 919 416 265 67 406 179 8658 1641 235 11667 0 1787 23988 10873 440 1214 428 571 99 0 300 13925 3325 238 11891 0 2382 31761 5647 1180 1073 464 407 250 517 344 9882 3088 7673 10048 83 2478 33252 0 0 8819 3241 10832 12606 0 3276 38774 213 1274 45 0.12 150 0 0 4211 272 1733 162 1989 235 2014 103 15 860 0 0 6537 Ready GO c G 0 51 Other Payables 52 Current Accrued Expenses 53 Current Provisions 54 Current Pension/Benefit Plans 55 Current Debt and Capital Lease Obligations 56 Current Deferred Liabilities 57 Other Current Liabilities 58 Total Current Liabilities 59 Long-Term Provisions 60 Long-Term Debt 61 Long-Term Capital Lease Obligations 62 Noncurrent Deferred Tax Liabilities 63 Trade and Other Payables 64 Derivative Product Liabilities 65 Preferred Securities Outside Stock Equity 66 Other Noncurrent Liabilities 67 Total Liabilities Net Minority Interest 68 Equity 69 Common Stock 70 Additional Paid-In Capital 71 Retained Earnings 72 Gains/(Losses) Not Affecting Retained Earnings 73 Stockholders' Equity 74 Minority Interest 75 Total Equity Gross Minority Interest 76 Total Liabilities and Equity B 45 942 469 199 150 38 517 3847 1527 3048 0 1041 52 1517 12210 741 23983 4211 941 0 0 0 11 5313 1996 4535 0 0 0 0 0 1811 13655 D 162 1289 1121 403 361 76 - 222 5639 2297 5707 1523 1027 70 0 311 315 16889 E 103 1543 1243 325 700 0 702 6865 2223 7560 1664 818 95 0 787 273 20285 F 0 6537 1442 0 185 0 0 9024 2546 9276 1644 0 0 0 204 935 23629 0 320 -8874 - 3 -8557 0 -8557 15426 0 20855 -10334 -188 10333 0 10333 23988 0 30739 - 16362 -187 14190 682 14872 31761 35931 -23130 -535 12266 701 12967 33252 0 38608 -23626 -524 14458 687 15145 38774 27 Financial Statements D 31761 E 33252 F 38774 2019 2020 2021 A1 Xv fx Income Statements (in Millions USD Except EPS) B C 76 Total Liabilities and Equity 15426 23988 77 78 Cash Flow Statements (in Millions USD) 2017 2018 79 Cash Flows from Operating Activities: 80 Consolidated Net Income -4033 987 81 Gain/(Loss) on Sale of Business 0 -3214 82 Gain/(Loss) on Sale of PPE 117 59 83 Net Foreign Currency Exchange Gain/(Loss) -59 53 84 Gain/(Loss) on Investment Securities 173 349 85 Earnings/(Losses) from Equity Investments 0 42 86 Depreciation and Amortization 510 126 87 Deferred Taxes -762 35 88 Asset Impairment Charge 305 268 89 Unrealized Gain/(Loss) on Investment Securities 0 -1996 90 Stock Based Compensation 124 170 91 Other Noncash Items 297 390 92 Changes in Accounts Receivables -442 -279 93 Changes in Prepaid Assets -120 -473 94 Changes in Accounts Payable -79 -39 95 Changes in Accrued Expense 1267 738 96 Changes in Other Current Assets 0 0 97 Changes in Other Current Liabilities 0 0 98 Changes in Other Working Capital 1284 943 99 Net Cash Provided by/(Used for) Operating Activities -1418 -1541 100 Cash Flows from Investing Activities: 101 Net PPE Purchase and Sale -479 -189 102 Purchase of Intangibles Financial Statements -8512 -444 - 10 16 -60 34 472 -88 92 0 4596 63 -407 -478 95 960 201 -153 -718 -4321 -6788 -204 0 48 0 34 575 -266 2170 125 827 2 142 94 -133 83 341 -131 336 -2745 -570 -1684 0 38 -413 37 902 -692 225 -1142 1168 4 -597 -236 90 1068 165 -184 1376 -145 -537 -613 -298 Ready B D E F G -479 -8 0 0 0 0 0 -487 -189 0 -476 0 -30 0 0 -695 -537 0 -7 293 -541 2 0 - 790 -613 0 -1471 91 -2111 1360 -125 -2869 -298 0 -2314 1000 -2095 2791 -285 -1201 mo Cash Flows from Investing Activities: 1 Net PPE Purchase and Sale 2 Purchase of Intangibles 3 Purchase of Business 94 Sale of Business s Purchase of Investment 6 Sale of Investment 7 Net Other Investing Changes 8 Net Cash Provided by/(Used for) Investing Activities 99 Cash Flows from Financing Activities: 0 Long-Term Debt Issuance 11 Long-Term Debt Payments 2 Short-Term Debt Issuance 13 Common Stock Issuance 14 Common Stock Payments 15 Preferred Stock Issuance 16 Proceeds from Stock Options Exercised 17 Other Financing Charges 18 Net Cash Provided by/(Used for) Financing Activities 19 Exchange Rate Effect 20 Net Cash Flow 21 Free Cash Flow: 22 Operating Cash Flow 23 Capital Expenditures 24 Free Cash Flow 5 2628 -1642 0 0 0 -88 202 0 - 131 1008 3 21 1015 22 -868 3466 -599 0 0 -10 1750 27 6 4640 -119 2285 1189 -165 0 8473 -74 1000 68 -1552 8939 -4 3824 0 247 125 21 1379 -92 -4327 1484 -560 0 0 0 675 107 74 1780 -69 65 -1418 -829 -2247 -1541 -558 -2099 -4321 -588 -4909 -2745 -616 -3361 -145 -298 -743 06 Financial Statements G H 1 Industry/Competitor Ratios: Lyft Inc. 2017 2018 2019 2020 2021 A B D E F 1 Uber Technologies Ratio Analysis Uber Technologies Ratios 3 Ratios 2017 2018 2019 2020 2021 4 Profitability Ratios: 5 Gross Profit Margin %, Two Decimal Places 6 OROR(OROS) 7 ROR(ROS) 8 OROIC 9 ROIC 10 OROA 11 ROA 12 OROE 13 ROE 14 OEPS S, Two Decimal Places 15 DOEPS 16 EPS 17 DEPS 18 Liquidity Ratios: 19 Current Ratio 8. Two Decimal Places 20 Quick Ratio 21 Net Working Capital S. O Decimal Places 22 Activity Ratios: 23 Inventory Turnover (IT) # Two Decimal Places 24 Receivables Turnover (RT) 25 Payables Tumover (PT) 26 Working Capital Turnover (WCT) 27 Fixed Asset Turnover (FAT) 28 Total Asset Turnover (TAT) 1. Ratio Analysis Profitability Analysis 20.47% 26.66% 22.21% 19,83% 36,03% (66.79%) (45.34%) (74.72) (7704%) (33.7396) (64.91%) (12.23%) (71.96%) (74.1296) (31.45%) (30.52%) (42.3296) (83.40%) (69 94%) (46,81%) (29.66%) (39.42%) (80.31%) (67.29%) (43.68%) (23.47%) (26.019) (47.4896) (38.94%) (22.6695) (22.80%) (24.23%) (45.72%) (37.479) (21.14%) (30.72%) (42.889) (94.67%) (108.719) (17.62%) (29.85%) (39.949) (91.17%) (104.599) (723876) $ (2.43) S (3.36) S (11.90) S (5.84) S (23) $ (2.43) S (3.36) S (1190) S (5.84) $ $ (2.36) S (3.13) S (1146) S (5.62) S (3.01 $ (236) S (313) S (11.46) S (5.62) S (301) (3.23) 3,68 NA $ 1,867 S 1.60 NA 8715 1.32 NA 7965 1.25 NA 520 $ 113 NA 312 NA NA 12.58 0,57 75 71 0.35 NA NA 49.44 2.18 19.79 0.57 NA NA 72.13 4,54 5.74 0.61 NA NA 22.57 4.35 102 051 NA NA 15.78 10:28 6.15 0.67 WILW Be Carefules from the Internet con contains Unless you need to edit it's safe to stay in Protected View Enable Editing F G 75.71 0.35 H 19.79 0:57 1 5.74 0.64 4.02 0.51 K 6.15 0.67 23.6096 0.0096 30.8996 NA 39 34% 0.00% 61.84% NA 0.37 0.85 0.31 19.85% 6.719 99 40% NA 2.61 1.51 3.93 64.1895 19.6096 179.1895 (5521) 0.91 1:57 1.47 70 80% 18.124 242.47% (20.81) (1.14) 114 (130) H19 1.60110420979986 B D E 27 Fixed Asset Turnover (FAT) 28 Total Asset Turnover (TAT) 29 Leverage Ratios: 30 Debt-to-Assets (D/A) 96, Two Decimal Places 31 Long-Term Debt to Assets (LTDA) 32 Debt-to-Equity (DE) 33 Times Interest-Eamed (TTE) # Two Decimal Places 34 DOL #. Two Decimal Places 35 DFL 36 DTL 37 Growth Ratios: 96, Two Decimal Places 38 Revenues or Sales 39 Gross Profit 40 Operating Profit 41 OROR OR OROS 42 ROR or ROS 43 OROIC 44 ROIC 45 OROE 46 ROE 17 OEPS 18 EPS 19 Fototes 50 Ratio form and what they show are found in Appendix A in the Chapter 11 S Outline S1 Percentage che ratios are calculated as (2 Yearly Year! 52 Growth ratione calculated as (Year 2-Yearly 53 5 Ratio Analysis Profitability Analysis 103.4946 164.98% 38.1496 (32.1296) (34.9395 38.6 32.9396 19.5946 33.819 38.1096 32.41% 67.60% (34.60%) 35 645 39.65% (41 599) 146.489 176 284 (32.57%) (40.619) 64.80% 3:10 (56.2255) 70.38% 3.019 (57 57%) 97.06% (16.035) (13.03%) 100.729 (16.214) 05 099) 120.8194 14839 (28.604 128289 14.729 (30.80) 254.17% (50.949) (14.699) 266.19% (50.989) (46.1996)
Step by Step Solution
There are 3 Steps involved in it

Get step-by-step solutions from verified subject matter experts