

Question: The first Graph is the Microsoft TS plot. I had to create the Time Series Plot using date and revenue for Microsoft the date starts
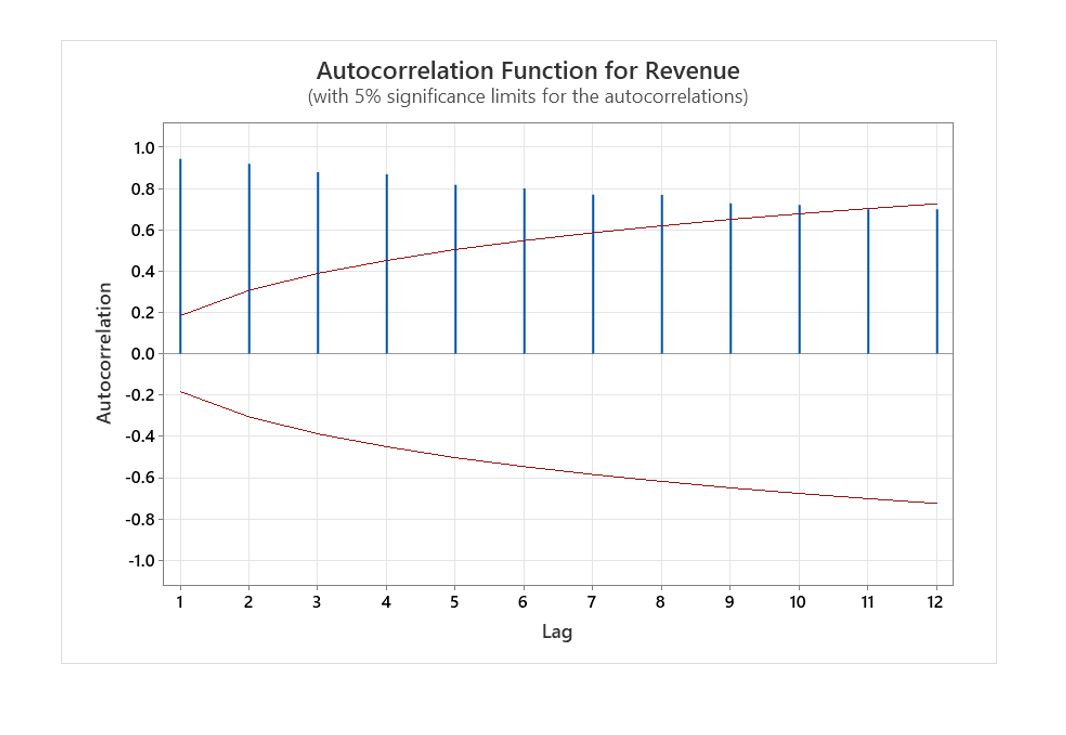
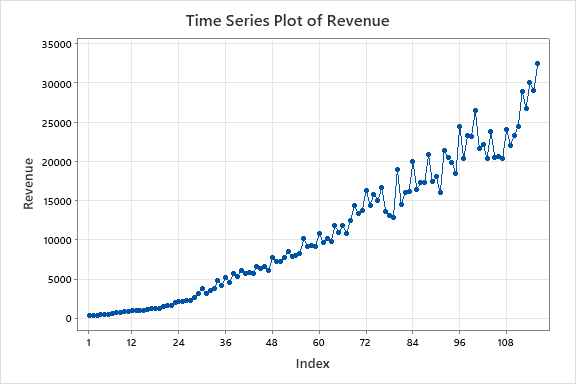
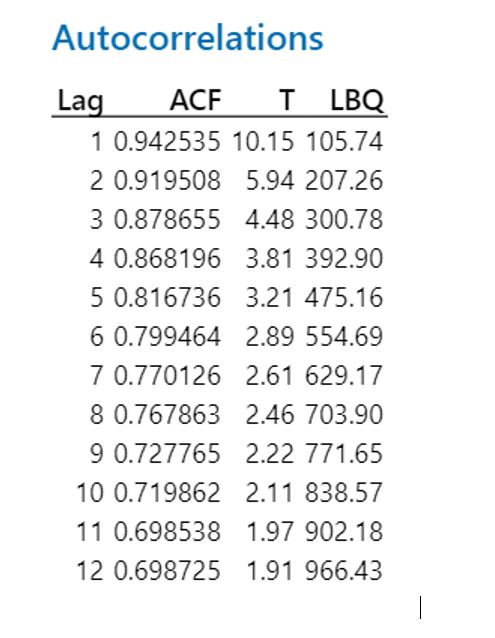
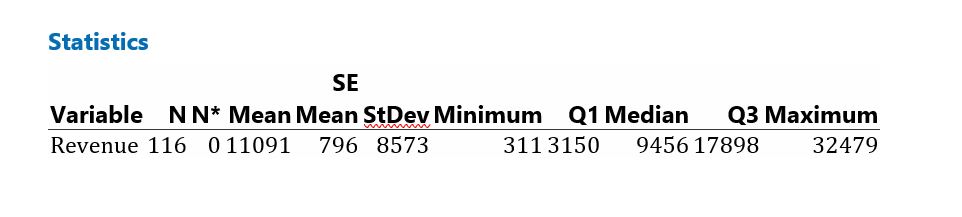
The first Graph is the Microsoft TS plot. I had to create the Time Series Plot using date and revenue for Microsoft the date starts from 1990 to 2018 ( Old date first). The second one is the Descriptive stats for Microsoft revenue data and the third and fourth picture is the Autocorrelation function for Microsoft revenue data.
1- describe the T, C, S components of your data based on the TS plot?
2- on the descriptive data (second picture) please explain briefly what the data say there?
3-For the ACF (third and fourth picture) discuss T, C, and S components.Are your conclusions consistent with your answer in part 4? Briefly
4- think about at least 3 different macroeconomic variables that you think will impact the revenue of your company Explain how the variables relate to your company revenue.What kind of relation do you expect? For example, if your company is Target, and you may want to pick income which should be directly (positively) related to target revenue because higher consumer income will increase consumption on goods and services, increasing Target revenu
Step by Step Solution
There are 3 Steps involved in it

Get step-by-step solutions from verified subject matter experts