

Question: the first photo is my data table and the second photo contains the questions I need help with. Thanks! 1.42 PM Tue May 23 Chem
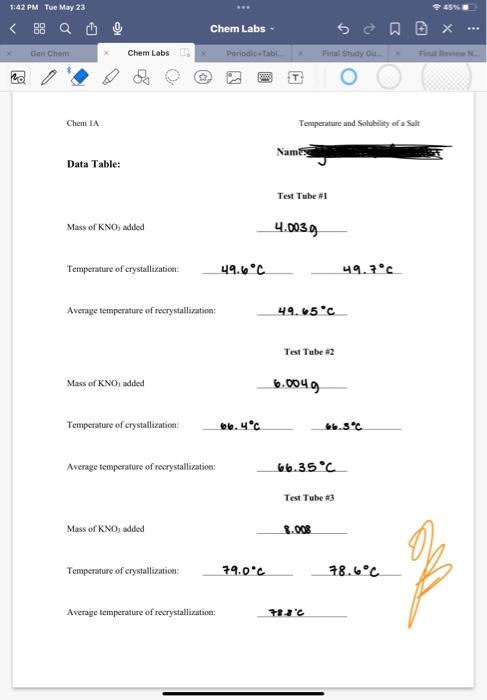
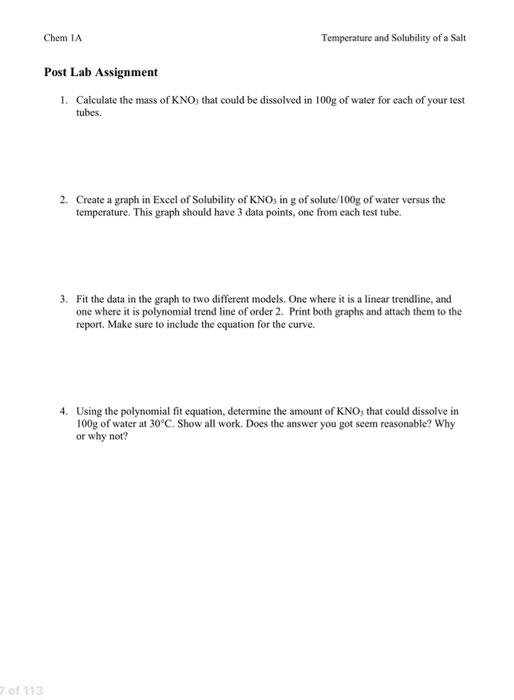
1.42 PM Tue May 23 Chem 1A Data Table: Mass of KNO3 added Temperature of crystallization: Average temperature of recrystaltization: Mass of KNO added Temperature of erystallization: Average tenaperature of rocrystallization: Mass of KNO3 added Temperahure of crystallization: Average temperature of recrysiallizatioa: Temperature and Solubulity of a Solt Test Tube I 4.0030 49.6C 49.7C 49. 65C Test Tube 2 6b. 4C 6.3C 66.35C Test Tube \#3 8.008 79.0C 78.6C 78.C hem 1A Temperature and Solubility of a Salt Post Lab Assignment 1. Calculate the mass of KNO3 that could be dissolved in 100g of water for each of your test tubes. 2. Create a graph in Excel of Solubility of KNO3 in g of solute/100g of water versus the temperature. This graph should have 3 data points, one from each test tube. 3. Fit the data in the graph to two different models. One where it is a linear trendline, and one where it is polynomial trend line of order 2. Print both graphs and attach them to the report. Make sure to include the equation for the curve. 4. Using the polynomial fit equation, determine the amount of KNO3 that could dissolve in 100g of water at 30C. Show all work. Does the answer you got seem reasonable? Why or why not
Step by Step Solution
There are 3 Steps involved in it

Get step-by-step solutions from verified subject matter experts