

Question: The first picture is a table we got from a lecture. Can someone help explain and interpret why each of those ratios increase/decrease/have no effect?
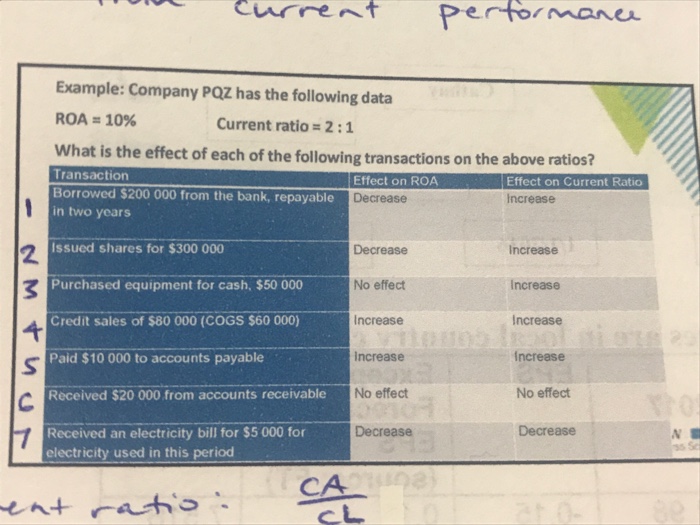
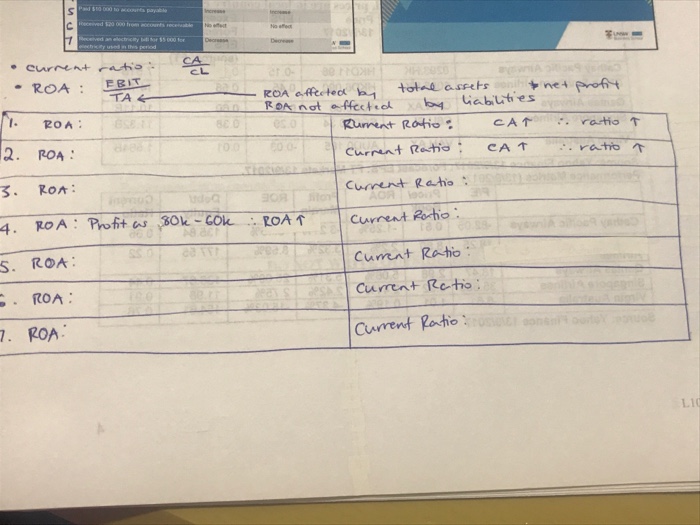
erformane Example: Company POZ has the following data ROA = 10% Current ratio = 2 : 1 What is the effect of each of the following transactions on the above ratios? Transaction Borrowed $200 000 from the bank, repayable in two years Effect on ROA Decrease Effect on Current Ratio Increase Issued shares for $300 000 Purchased equipment for cash, $50 000 Credit sales of $80 000 (COGS $60 000) Paid $10 000 to accounts payable Received $20 000 from accounts receivable 2 Decrease Increase No effect Increase Increase Increase Increase Increase No effect Decrease No effect Decrease Received an electricity bill for $5 000 for electricity used in this period CL
Step by Step Solution
There are 3 Steps involved in it

Get step-by-step solutions from verified subject matter experts