

Question: The first table is Wizzair Holding the second one is Tesco [25 pts] Perform correlation analysis between the two companies price data. You can use
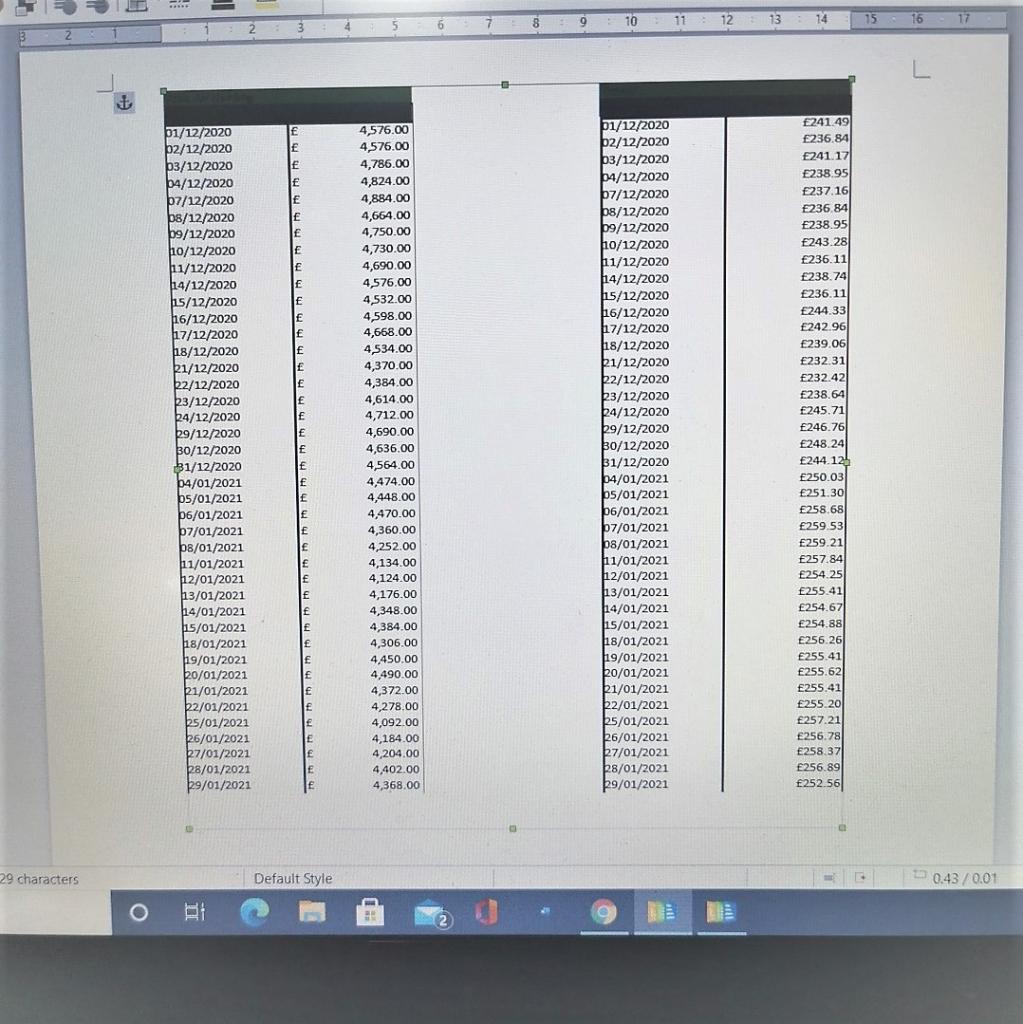 The first table is Wizzair Holding the second one is Tesco [25 pts] Perform correlation analysis between the two companies price data. You can use excel to calculate correlations between daily return of the two companies. Note that correlation is not a plot but just a number between -1 and 1. Make sure you only use adjusted closing price (or equivalent depending on the data source). [20 pts] Compare and analyse the two mentioned trends. Plot two trends in the same graph (you can use Excel for this). Plot these trends on your own in Excel. [10 pts] From your observation, argue whether there is a relationship between the two trends. [10 pts] Explain possible reasons for the behaviour of the trends and the relationship between the two datasets, with your critical opinions and the support of at least one academic journal article. [10 pts] The referencing format should be Harvard referencing style.
7 3 8 14 10 11 12 13 9 15 4 16 5 17 21 L E E E241.49 236.84 241.17 E E E E E E E E E E E p1/12/2020 $2/12/2020 $3/12/2020 4/12/2020 p7/12/2020 ps/12/2020 p9/12/2020 110/12/2020 111/12/2020 114/12/2020 115/12/2020 116/12/2020 17/12/2020 118/12/2020 1/12/2020 b211212020 $3/12/2020 14/12/2020 29/12/2020 30/12/2020 31/12/2020 14/01/2021 5/01/2021 $6/01/2021 porn $7/01/2021 8/01/2021 11/01/2021 h12/01/2021 pu 13/01/2021 ha/01/2021 15/01/2021 18/01/2021 19/01/2021 bo/01/2021 11/01/2021 Kuusel 2/01/2021 5/01/2021 26/01/2021 27/01/2021 28/01/2021 29/01/2021 E E E E 4,576.00 4,576.00 4,786.00 4,824.00 4,884.00 4,664.00 4,750.00 4,730.00 4,690.00 4,576.00 4,532.00 4,598.00 4,668.00 4,534.00 4,370.00 4,384.00 4,614.00 4,712.00 4,690.00 4,636.00 4,564.00 4,474.00 4,448.00 4,470.00 4,360.00 4,252.00 4,134.00 4,124.00 4,176.00 . 4,348.00 4,384.00 4,306.00 4.450.00 4,490.00 4,372.00 4,278.00 4,092.00 4,184.00 4.204.00 4,402.00 4,368.00 21/12/2020 p2/12/2020 3/12/2020 4/12/2020 $7/12/2020 8/12/2020 p9/12/2020 10/12/2020 11/12/2020 14/12/2020 15/12/2020 16/12/2020 27/12/2020 18/12/2020 1/12/2020 2/12/2020 23/12/2020 24/12/2020 9/12/2020 $0/12/2020 31/12/2020 b021 24/01/2021 5/01/2021 p6/01/2021 $7/01/2021 p8/01/2021 pov. 11/01/2021 12/01/2021 13/01/2021 14/01/2021 15/01/2021 18/01/2021 19/01/2021 20/01/2021 1/01/2021 2/01/2021 5/01/2021 $6/01/2021 7/01/2021 8/01/2021 9/01/2021 E E 238.95 237.16 236.84 238.95 243.28 236.11 238.74 236.11 244.33 242 96 239.06 232.31 232.42 238.64 245.71 246.76 248.24 244.12! 250.03 251.30 28 se 258.68 COLOR 259.53 259.21 257.84 254.25 E255.41 254.67 254.88 . 256.26 . 255.41 255.62 E255.41 255.201 257.21 256.78 258.37 256.89 252.56 E E E E E E E E 29 characters Default Style 0.43 / 0.01 9 2
Step by Step Solution
There are 3 Steps involved in it

Get step-by-step solutions from verified subject matter experts