Question: The first tool I used to predict is called Sensitivity Analysis. Sensitivity Analysis involves [explain The Breakeven point shows how much of a product needs
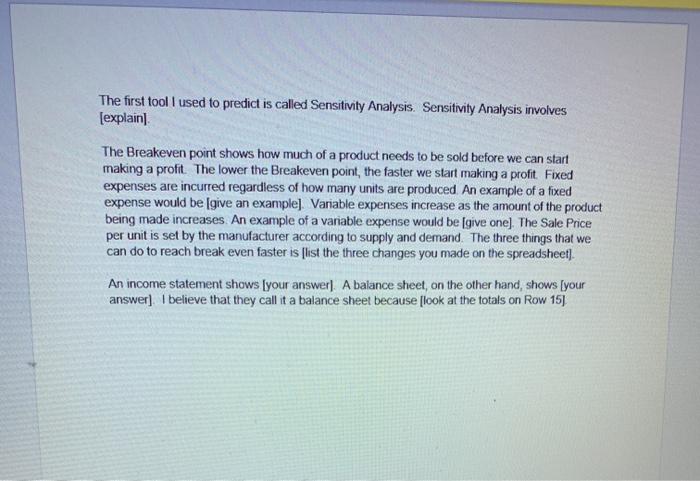
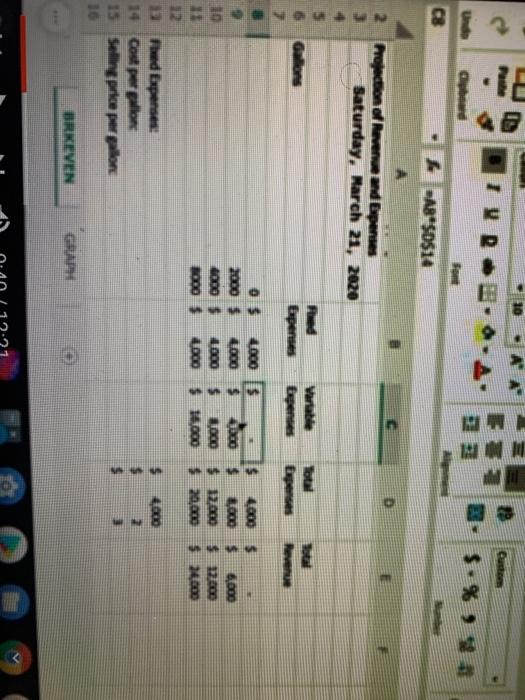
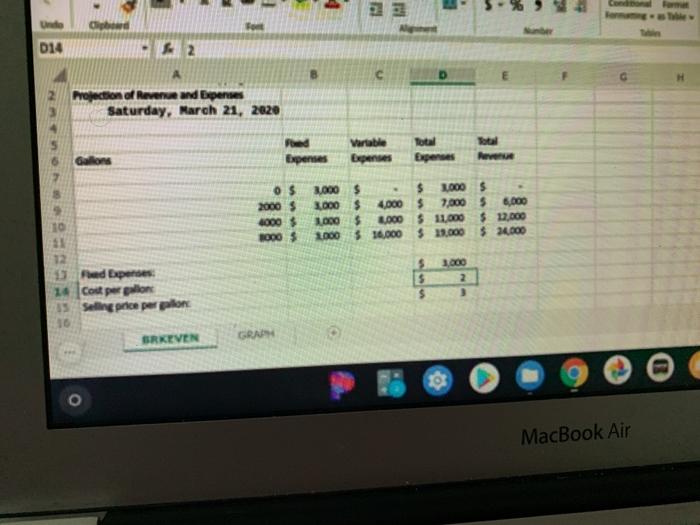
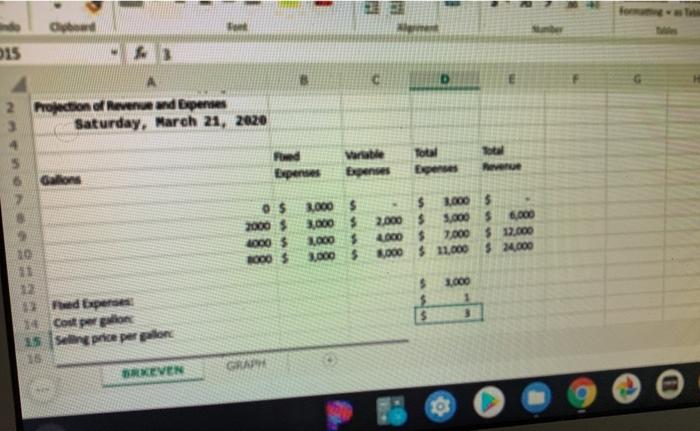
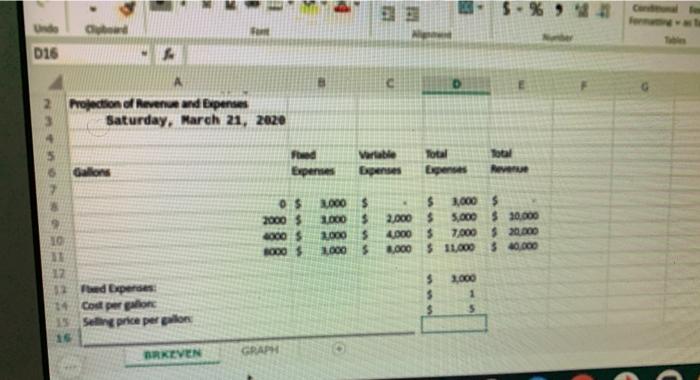
The first tool I used to predict is called Sensitivity Analysis. Sensitivity Analysis involves [explain The Breakeven point shows how much of a product needs to be sold before we can start making a profit. The lower the Breakeven point , the faster we start making a profit. Fixed expenses are incurred regardless of how many units are produced An example of a fixed expense would be give an example). Variable expenses increase as the amount of the product being made increases. An example of a variable expense would be give one). The Sale Price per unit is set by the manufacturer according to supply and demand. The three things that we can do to reach break even faster is [list the three changes you made on the spreadsheet]. An income statement shows [your answer). A balance sheet, on the other hand, shows [your answer] I believe that they call it a balance sheet because [look at the totals on Row 15) 18 EE phone C8 Sot -A8*$0$14 2 Projection of Revenue and Expenses Saturday, March 21, 2020 Gabon Expenses Revenge 2000$ 40005 $ 4,000 $ Taco $ 8,000 $4,000 4000 $1,000 $ 12.000 17.00 4000$ 14,000 $20,000 $24.000 1000$ 13 Fed Expenses: 14 Cost per gallon 15 Selling price per por 5 2 BRKEVEN Cipowd Unde 014 Projection of Revenue and Expenses Saturday, March 21, 2020 Feed Expenses Vartable Expenses Expenses Revenue 0 $ 2000$ 4000$ 1000 $ 3,000 $ 2000$ 1.000 1000 $ 1.000 $ 4.000 $ 7.000 5 8.000 L000 $ 11,000 $ 12.000 14.000 $19.000 $ 240.000 10 11 12 Fred Expenses 14 coll per pillon 15 Selling price per pillon 1.000 $ $ $ 2 BRKIVEN o MacBook Air - optamil 15 C 2 Projection of Revenue and Expenses 3 Saturday, March 21, 2020 Total Found Expenses Variable penses Total Expenses 0$ 2000$ 40005 000 $ 3,000 $ 3.000 $ 1.0005 1,005 $ 2.000 40005 1.000 2.000 6 5.000 56.000 7.000 5 12.000 11.000 $ 4.000 1000 5 3 * Fed Expenses Coupe 15 Seprio per por 15 BREVEN GRAM 5%% 016 Projection of Revenue and Expense Saturday, March 21, 2020 ad Expenses Vertable Expenses Total Expenses Total Revenue 0$ 2000 000 $ RODOS 1000 1.000 1.000 1000 $ $ S $ 3,000 $ 2.000 $ 5.000 $20,000 4.800 $ 7.000 $ 20.000 3.000 $ 11,000 $ 0.00 $ Fed Diperces Cooperation price per i 5 13 BRKIVEN GRAPH