

Question: the first two pull downs are increases or decreases and the third one is gain or loss Suppose Jordan is open to free trade in
the first two pull downs are increases or decreases and the third one is gain or loss
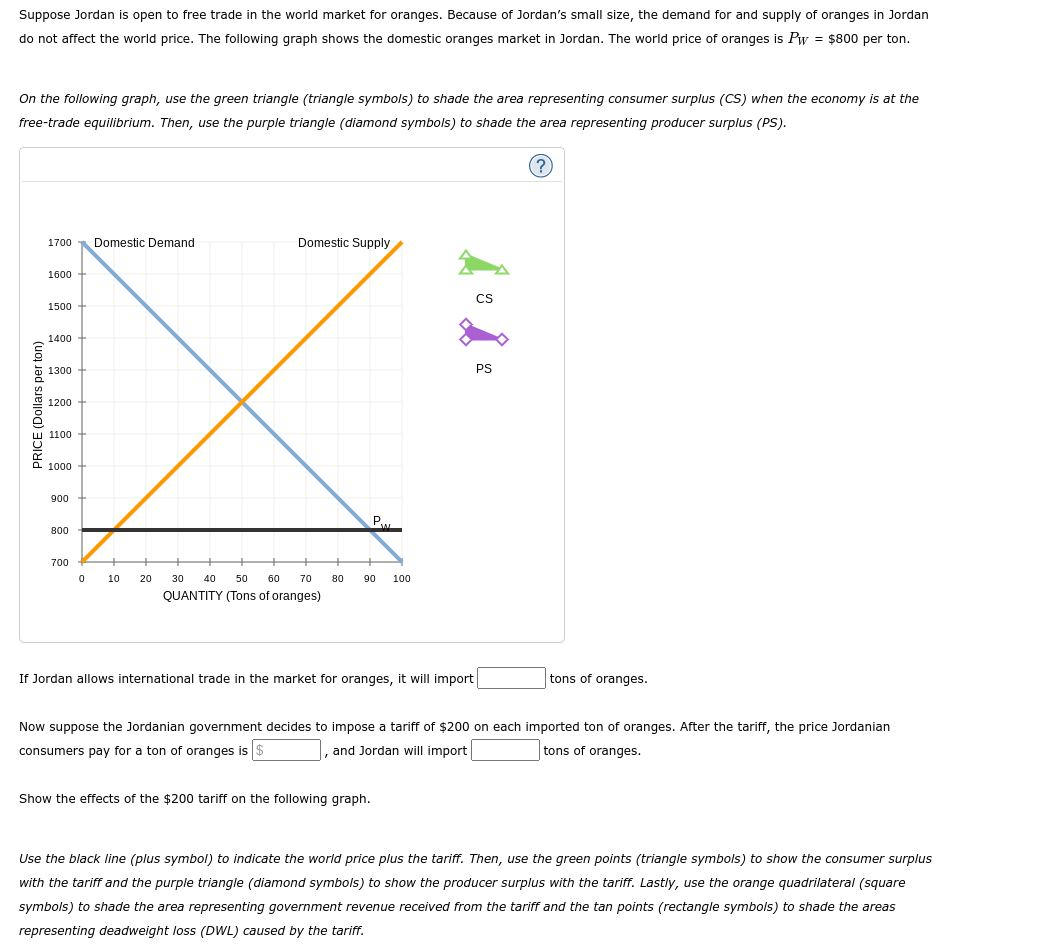
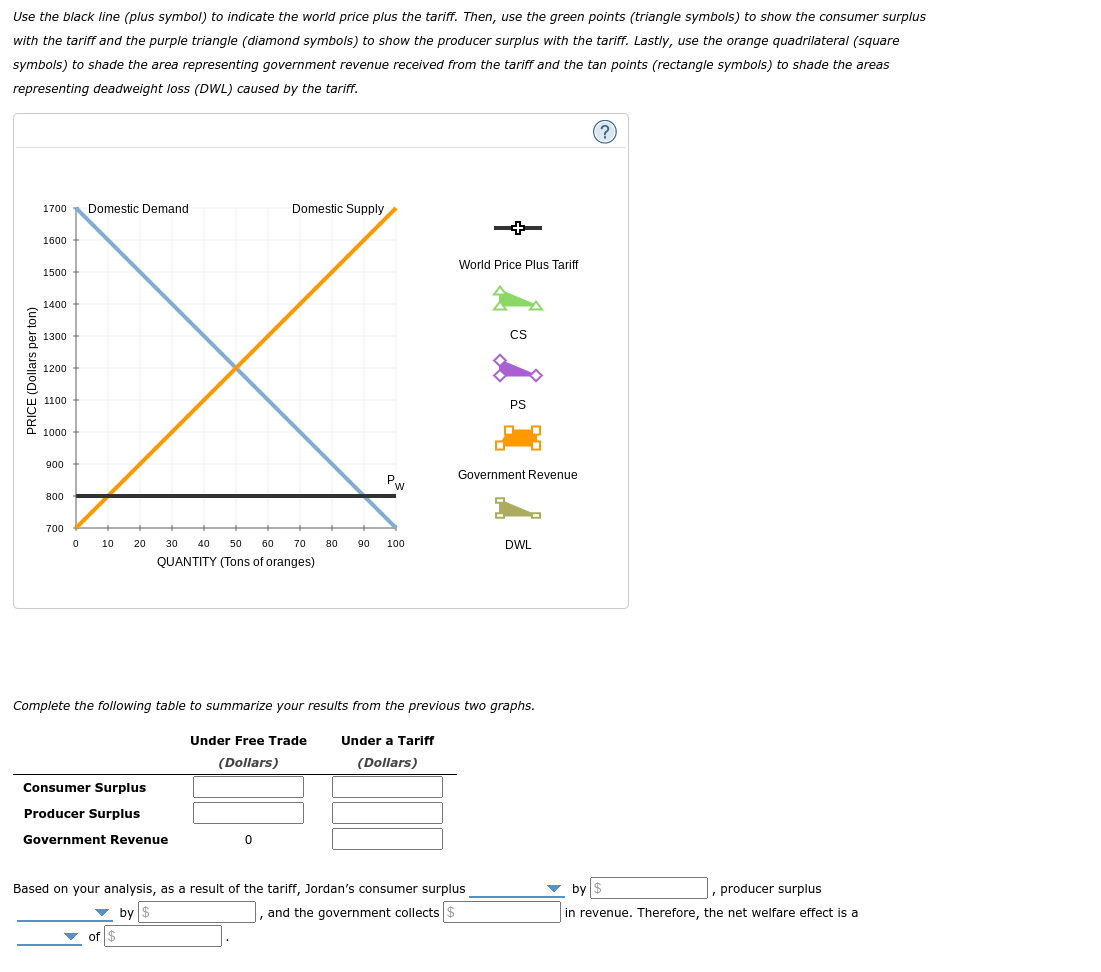
Suppose Jordan is open to free trade in the world market for oranges. Because of Jordan's small size, the demand for and supply of oranges in Jordan do not affect the world price. The following graph shows the domestic oranges market in Jordan. The world price of oranges is Pw = $800 per ton. On the following graph, use the green triangle (triangle symbols) to shade the area representing consumer surplus (CS) when the economy is at the free-trade equilibrium. Then, use the purple triangle (diamond symbols) to shade the area representing producer surplus (PS). (?) 1700 - Domestic Demand Domestic Supply 1600 1500 CS 1300 1200 PRICE (Dollars per ton) 1400 PS W 1100 1000 900 800 700 0 10 20 30 40 50 60 70 80 90 100 QUANTITY (Tons of oranges) If Jordan allows international trade in the market for oranges, it will import tons of oranges. Now suppose the Jordanian government decides to impose a tariff of $200 on each imported ton of oranges. After the tariff, the price Jordanian consumers pay for a ton of oranges is |$ |, and Jordan will import tons of oranges. Show the effects of the $200 tariff on the following graph. Use the black line (plus symbol) to indicate the world price plus the tariff. Then, use the green points (triangle symbols) to show the consumer surplus with the tariff and the purple triangle (diamond symbols) to show the producer surplus with the tariff. Lastly, use the orange quadrilateral (square symbols) to shade the area representing government revenue received from the tariff and the tan points (rectangle symbols) to shade the areas representing deadweight loss (DWL) caused by the tariff.Use the black line (plus symbol) to indicate the world price plus the tariff. Then, use the green points (triangle symbols) to show the consumer surplus with the tariff and the purple triangle (diamond symbols) to show the producer surplus with the tariff. Lastly, use the orange quadrilateral (square symbols) to shade the area representing government revenue received from the tariff and the tan points (rectangle symbols) to shade the areas representing deadweight loss (DWL) caused by the tariff. 1700 - Domestic Demand Domestic Supply + 1600 1500 World Price Plus Tariff PRICE (Dollars per ton) 1400 51300 CS 1200 1100 DS 1000 900 PW Government Revenue 800 700 0 10 20 30 40 50 60 70 80 90 100 DWL QUANTITY (Tons of oranges) Complete the following table to summarize your results from the previous two graphs. Under Free Trade Under a Tariff (Dollars) (Dollars) Consumer Surplus Producer Surplus Government Revenue Based on your analysis, as a result of the tariff, Jordan's consumer surplus by $ , producer surplus by $ , and the government collects |$ in revenue. Therefore, the net welfare effect is a of $
Step by Step Solution
There are 3 Steps involved in it

Get step-by-step solutions from verified subject matter experts