

Question: the fixed cost is $1,000. The variable cost is $2,000. 4. (14 points) Using Excel, or on the graph provided (Figure 3), plot average total
 the fixed cost is $1,000. The variable cost is $2,000.
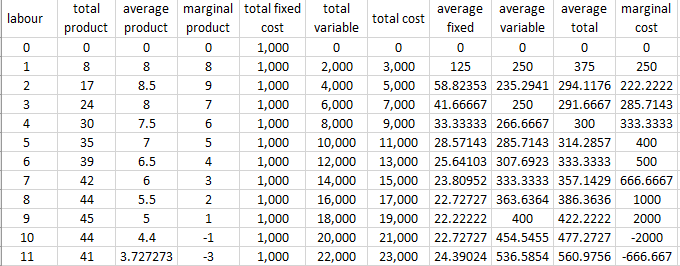
4. (14 points) Using Excel, or on the graph provided (Figure 3), plot average total cost, average variable cost, average fixed cost, and marginal cost. Total product should be on the horizontal (x-axis). If created in Excel, print the graph, otherwise draw on the graph provided. Use the graph and table to answer the following questions: 1. Identify the economic capacity and write it below. 2. Identify the shutdown price and write it below. 3. Identify the break even price and write it below. 4. If the price is 400 , how many carved birds are produced? 5. If the price is 400 , what is the total revenue? 6. If the price is 400 , what is the economic profit? 7. On the graph, label the firm's individual supply curve. 8. Describe the shape of the AFC cost curve. Why does it have this shape? 4. (14 points) Using Excel, or on the graph provided (Figure 3), plot average total cost, average variable cost, average fixed cost, and marginal cost. Total product should be on the horizontal (x-axis). If created in Excel, print the graph, otherwise draw on the graph provided. Use the graph and table to answer the following questions: 1. Identify the economic capacity and write it below. 2. Identify the shutdown price and write it below. 3. Identify the break even price and write it below. 4. If the price is 400 , how many carved birds are produced? 5. If the price is 400 , what is the total revenue? 6. If the price is 400 , what is the economic profit? 7. On the graph, label the firm's individual supply curve. 8. Describe the shape of the AFC cost curve. Why does it have this shape
Step by Step Solution
There are 3 Steps involved in it

Get step-by-step solutions from verified subject matter experts