

Question: The following ANOVA table is testing for significant differences between employment groups in the number of sexual partners reported last year. Using only the information
The following ANOVA table is testing for significant differences between employment groups in the number of sexual partners reported last year. Using only the information given:
a) Calculate how many categories of employment groups were analyzed
b) Give the total number of respondents surveyed.
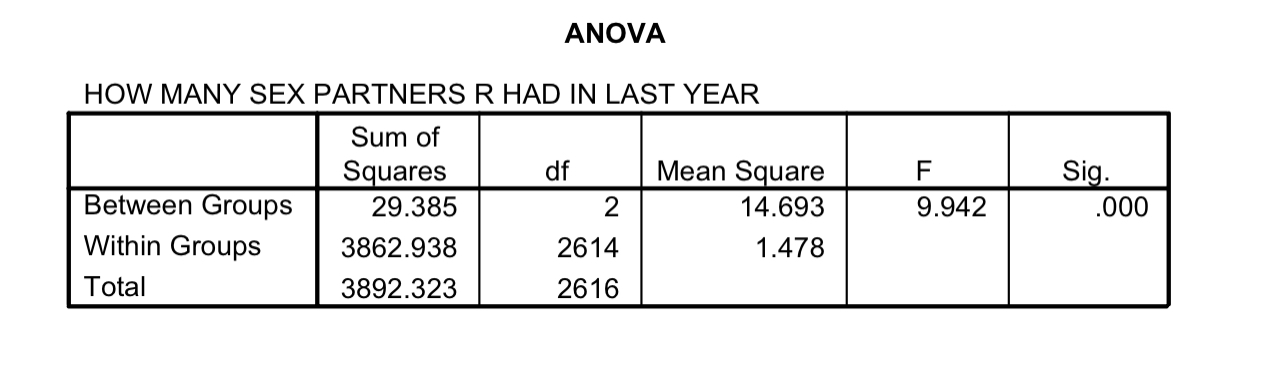
ANOVA HOW MANY SEX PARTNERS R HAD IN LAST YEAR Sum of Squares df Mean Square F Sig. Between Groups 29.385 2 14.693 9.942 000 Within Groups 3862.938 2614 1.478 Total 3892.323 2616
Step by Step Solution
There are 3 Steps involved in it
1 Expert Approved Answer
Step: 1 Unlock

Question Has Been Solved by an Expert!
Get step-by-step solutions from verified subject matter experts
Step: 2 Unlock
Step: 3 Unlock