

Question: The following atomic absorption (AA) data was obtained for a series of Na + standards. Plot the data points for the average absorbance with conc.
The following atomic absorption (AA) data was obtained for a series of Na+ standards. Plot the data points for the average absorbance with conc. Na+ on the x axis and the instrument reading on the y axis. Include vertical error bars representing the standard deviation of the absorbance readings. The calibration curve that you obtain is slightly curved! One way to handle a curved calibration line is to fit the data to a power series. A cubic equation (y = a + bx + cx2 + dx3) is usually sufficient to fit this type of case. Check the equation of the trendline and determine the coefficients. Using an appropriate equation, find the concentration of Na+ in an unknown sample if the AA reading is (a) 180 or (b) 135.
PLEASE PLOT IN EXCEL AND SHOW HOW TO INPUT FORMULAS.
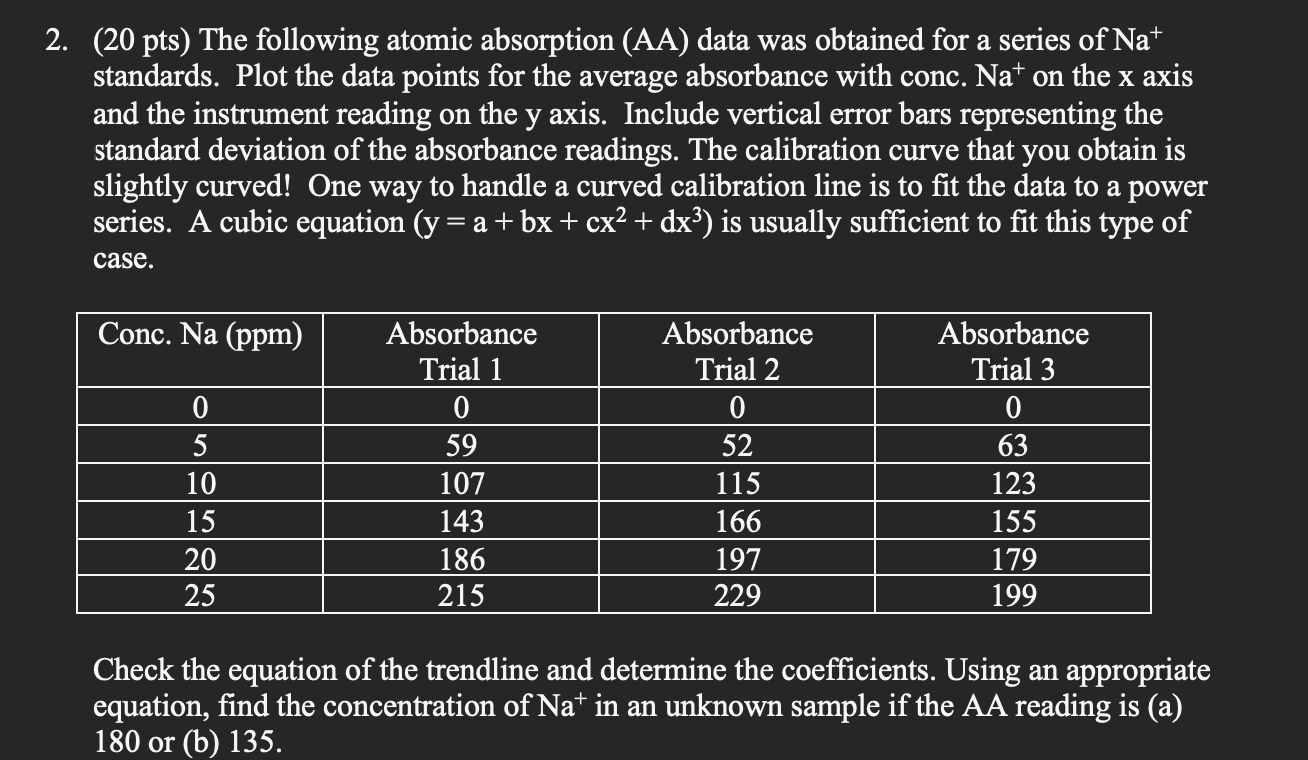
(20 pts) The following atomic absorption (AA) data was obtained for a series of Na+ standards. Plot the data points for the average absorbance with conc. Na+on the x axis and the instrument reading on the y axis. Include vertical error bars representing the standard deviation of the absorbance readings. The calibration curve that you obtain is slightly curved! One way to handle a curved calibration line is to fit the data to a power series. A cubic equation (y=a+bx+cx2+dx3) is usually sufficient to fit this type of case. Check the equation of the trendline and determine the coefficients. Using an appropriate equation, find the concentration of Na+in an unknown sample if the AA reading is (a) 180 or (b) 135
Step by Step Solution
There are 3 Steps involved in it

Get step-by-step solutions from verified subject matter experts