

Question: The following BASIC code simulates the single-server queue with FIFO service. It generates the interarrival times and the service times for 100.000 customers; and it
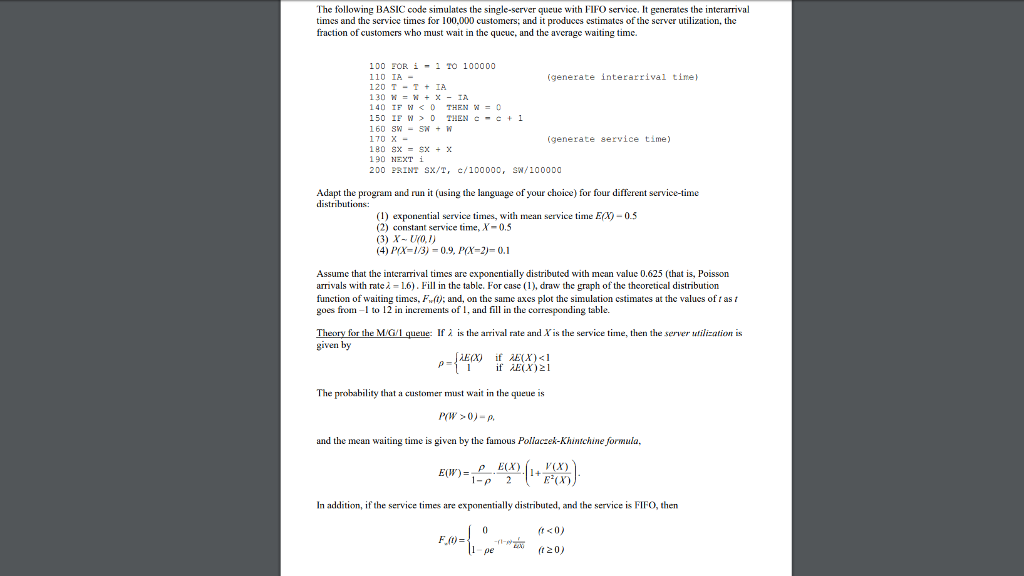
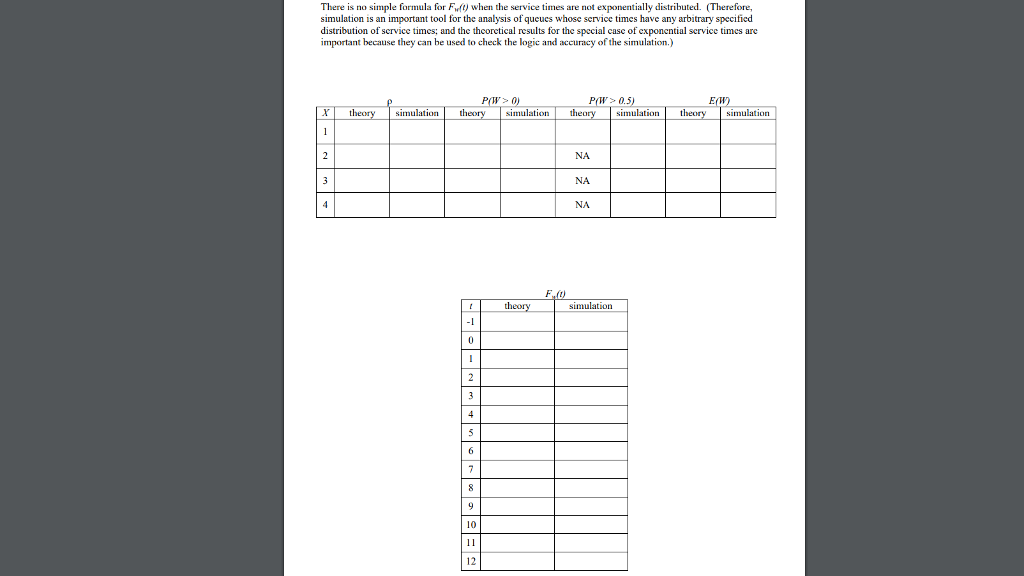
The following BASIC code simulates the single-server queue with FIFO service. It generates the interarrival times and the service times for 100.000 customers; and it produccs estimates of the server utilization, the fraction of customers who must wait in the queue, and the avcrage waiting time. 100 FOR ? " 1 TO 100000 110 IA- 120 T-TIA 130 -X-IA 140 IF w D THEN c-c+1 (generate interarrival time (generate service time) 190 NEXT ? 200 ERINT SX/T, e/100000, SN/100000 Adapt the program and run it (using the language of your choice) for four different service-time (1) exponential service times, with mean service time E(a)-0.5 (2) constant service time, X-0.5 (3) X-, UfOJ) (4) P(X IB)-0.9, PX-2)-01 Assume that the interarrival times are exponentially distributed with mean value 0.625 (that is, Poisson arr vals with rate ? = 1.6) . Fill in the table. For case (1), draw the graph of the theoretical distribution function of waiting times. F.ft: and, on the same axes plot the simulation cstimates at the values of t as t goes from - to 12 in increments of 1, and fill in the corresponding table. If ? ls the arrival rate and Xis the service time, then the server liti ization 1s Theorv for the MG 1 queue: given by The prohability that a customer must wait in the queue is and the mcan waiting time is given by the famous Pollaczek-Khintchine formula. E(W) In addition, if the service times are exponentially distributed, and the service is FIFO, then (t D THEN c-c+1 (generate interarrival time (generate service time) 190 NEXT ? 200 ERINT SX/T, e/100000, SN/100000 Adapt the program and run it (using the language of your choice) for four different service-time (1) exponential service times, with mean service time E(a)-0.5 (2) constant service time, X-0.5 (3) X-, UfOJ) (4) P(X IB)-0.9, PX-2)-01 Assume that the interarrival times are exponentially distributed with mean value 0.625 (that is, Poisson arr vals with rate ? = 1.6) . Fill in the table. For case (1), draw the graph of the theoretical distribution function of waiting times. F.ft: and, on the same axes plot the simulation cstimates at the values of t as t goes from - to 12 in increments of 1, and fill in the corresponding table. If ? ls the arrival rate and Xis the service time, then the server liti ization 1s Theorv for the MG 1 queue: given by The prohability that a customer must wait in the queue is and the mcan waiting time is given by the famous Pollaczek-Khintchine formula. E(W) In addition, if the service times are exponentially distributed, and the service is FIFO, then (t
Step by Step Solution
There are 3 Steps involved in it

Get step-by-step solutions from verified subject matter experts