

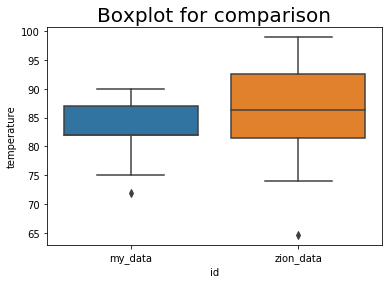
Question: The following box plot is generated from your temperature distributions temperatures = [90, 82, 81, 84, 88, 82, 88, 82, 72, 75, 82, 82, 84,
The following box plot is generated from your temperature distributions
temperatures = [90, 82, 81, 84, 88, 82, 88, 82, 72, 75, 82, 82, 84, 90]
The graph showed the difference in the distribution of your data and Zion's data? What can you say about the differences in data distributions?
(Note: You are not required to know how this data was generated. Note that the temperature data for Zion will be unique to you.)
\f
Step by Step Solution
There are 3 Steps involved in it
1 Expert Approved Answer
Step: 1 Unlock

Question Has Been Solved by an Expert!
Get step-by-step solutions from verified subject matter experts
Step: 2 Unlock
Step: 3 Unlock