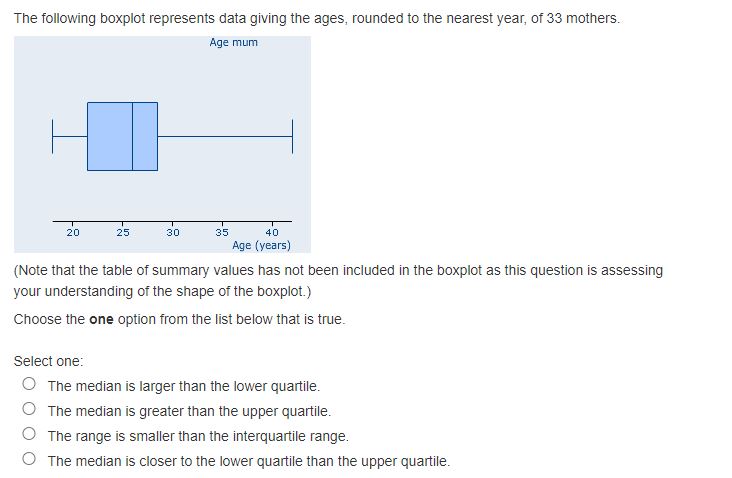
Question: The following boxplot represents data giving the ages, rounded to the nearest year, of 33 mothers. Age mum 20 25 30 35 40 Age (

The following boxplot represents data giving the
The following boxplot represents data giving the ages, rounded to the nearest year, of 33 mothers. Age mum 20 25 30 35 40 Age ( years) (Note that the table of summary values has not been included in the boxplot as this question is assessing your understanding of the shape of the boxplot.) Choose the one option from the list below that is true. Select one: The median is larger than the lower quartile. The median is greater than the upper quartile. The range is smaller than the interquartile range. The median is closer to the lower quartile than the upper quartile

Step by Step Solution

There are 3 Steps involved in it

1 Expert Approved Answer
Step: 1 Unlock blur-text-image
Question Has Been Solved by an Expert!

Get step-by-step solutions from verified subject matter experts

Step: 2 Unlock
Step: 3 Unlock

Students Have Also Explored These Related Mathematics Questions!