

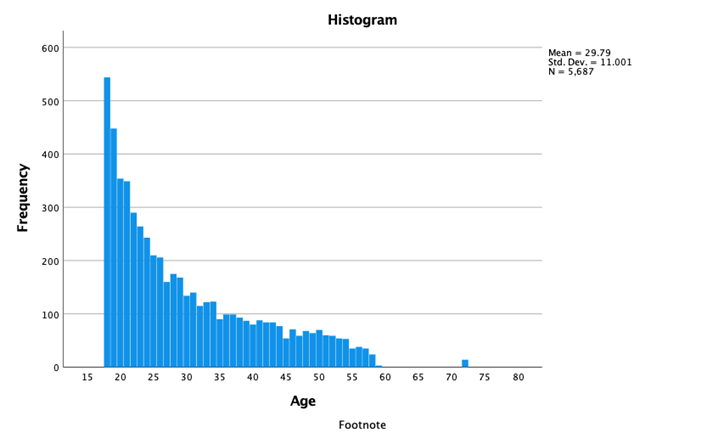
Question: The following chart displays a histogram for an age variable for a sample of 5,687 probationers. With a minimum value of 18 and a maximum
The following chart displays a histogram for an age variable for a sample of 5,687 probationers. With a minimum value of 18 and a maximum value of 72, the average age of these probationers is 29.79 years, the median is 26 years, and the standard deviation is 11.00. Using the histogram and these descriptive statistics, discuss the shape of this distribution in a couple of sentences (be sure to include a comparison the mean and median values).
Step by Step Solution
There are 3 Steps involved in it
1 Expert Approved Answer
Step: 1 Unlock

Question Has Been Solved by an Expert!
Get step-by-step solutions from verified subject matter experts
Step: 2 Unlock
Step: 3 Unlock