

Question: The following chart represents your sandwich prep time IMR control charts set of your sandwich process. You are the Lead Green Belt of a Quality
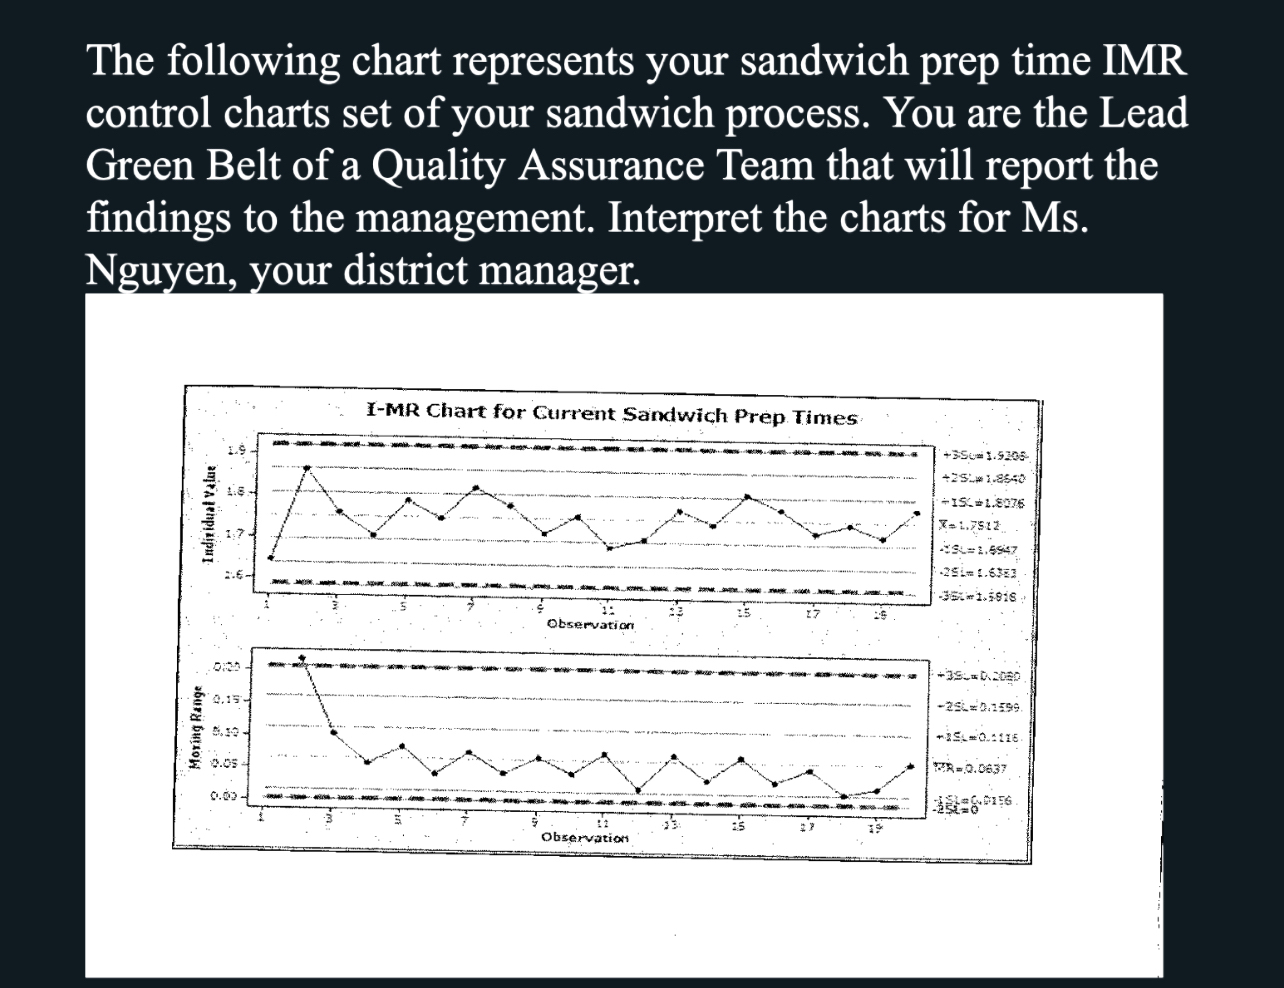
The following chart represents your sandwich prep time IMR control charts set of your sandwich process. You are the Lead Green Belt of a Quality Assurance Team that will report the findings to the management. Interpret the charts for Ms Nguyen, your district manager.
Step by Step Solution
There are 3 Steps involved in it
1 Expert Approved Answer
Step: 1 Unlock

Question Has Been Solved by an Expert!
Get step-by-step solutions from verified subject matter experts
Step: 2 Unlock
Step: 3 Unlock