

Question: The following chart shows the dynamic modulus ( E * * ) of a HMA mixture at 7 0 F . 2 . 1 )
The following chart shows the dynamic modulus of a HMA mixture at
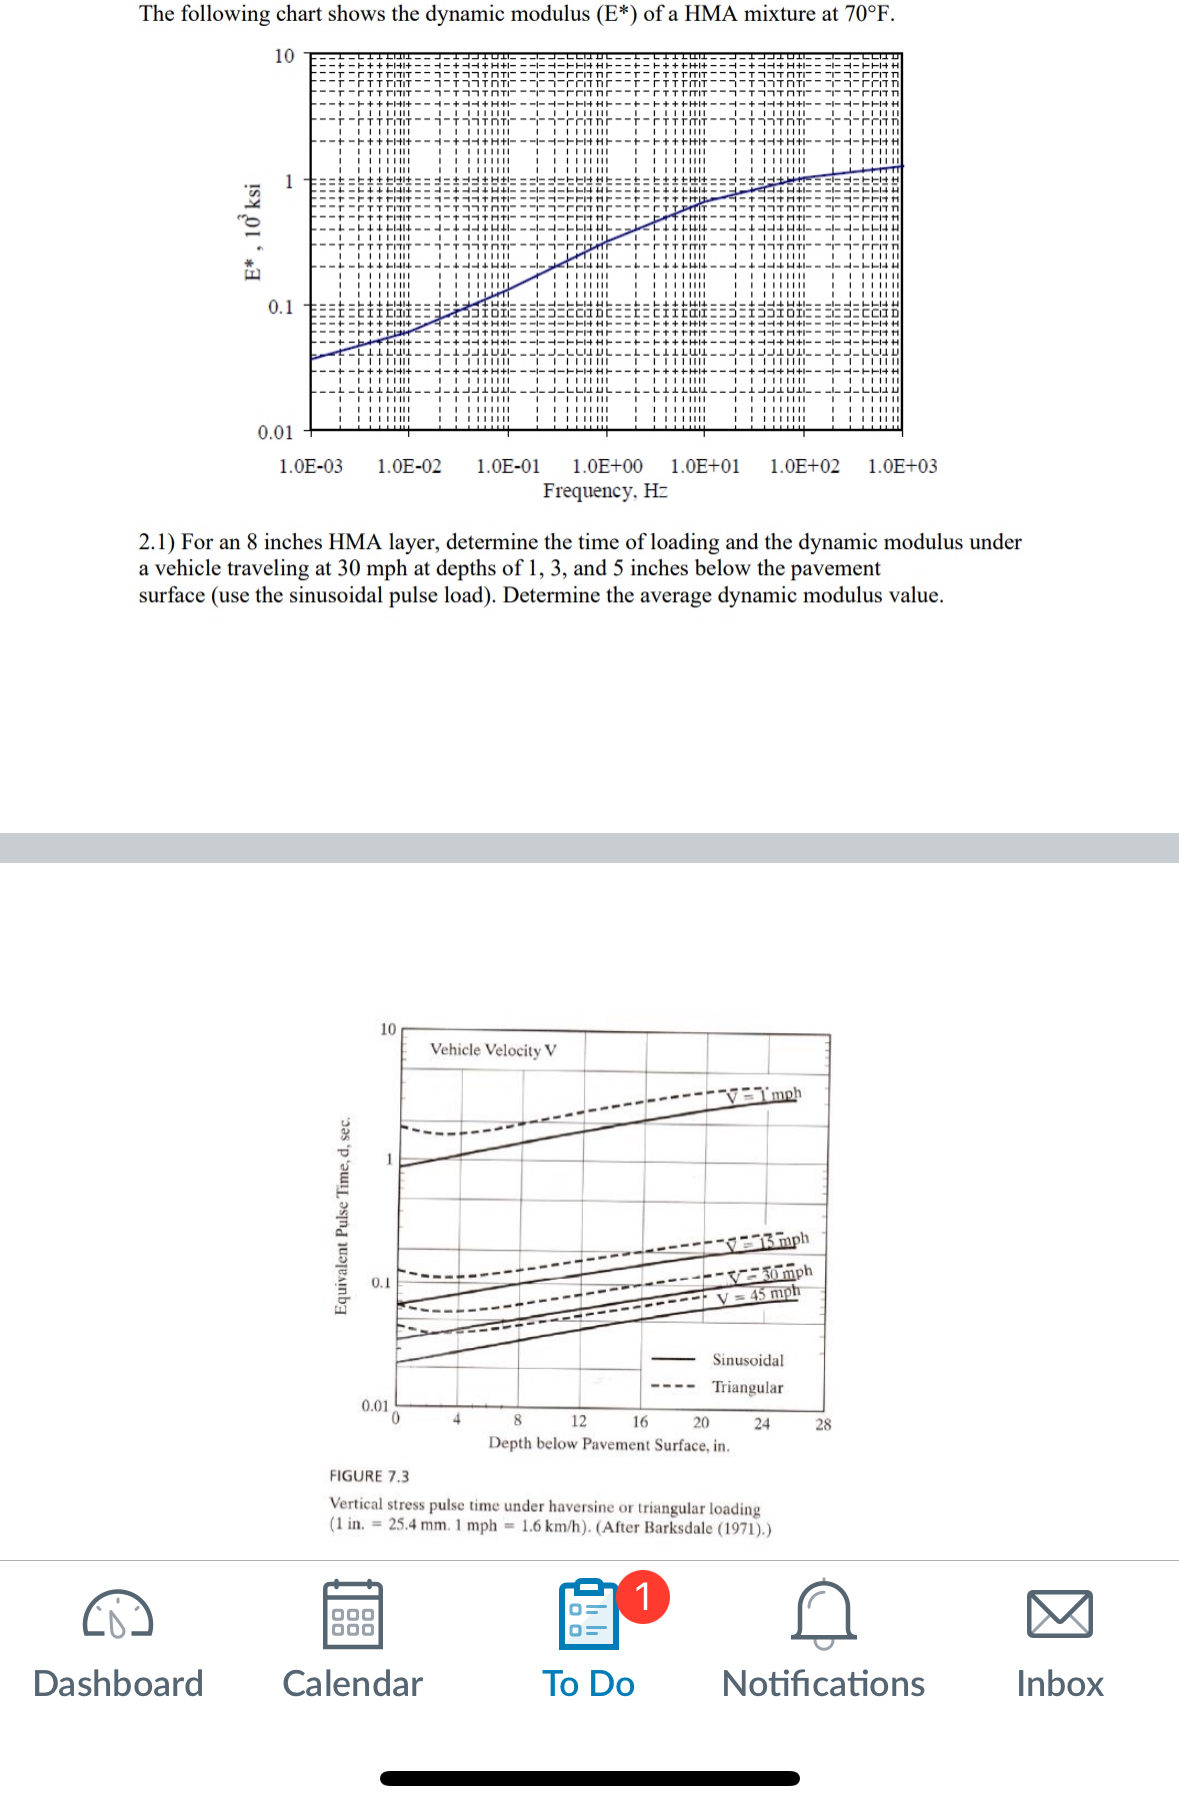
For an inches HMA layer, determine the time of loading and the dynamic modulus under a vehicle traveling at at depths of and inches below the pavement surface use the sinusoidal pulse load Determine the average dynamic modulus value.
FIGURE
Vertical stress pulse time under haversine or triangular loading in After Barksdale
Dashboard
Calendar
To Do
Notifications
Inbox
Step by Step Solution
There are 3 Steps involved in it
1 Expert Approved Answer
Step: 1 Unlock

Question Has Been Solved by an Expert!
Get step-by-step solutions from verified subject matter experts
Step: 2 Unlock
Step: 3 Unlock