

Question: The following code imports this file into MATLAB and plots the power spectrum of the signal. clear all clear all variables ('Flute.nonvib.ff.C4.stereo.aif'); [x, Fs]
![spectrum of the signal. clear all clear all variables ('Flute.nonvib.ff.C4.stereo.aif'); [x, Fs]](https://dsd5zvtm8ll6.cloudfront.net/si.experts.images/questions/2022/11/637ceda98ee10_689637ceda94c954.jpg)
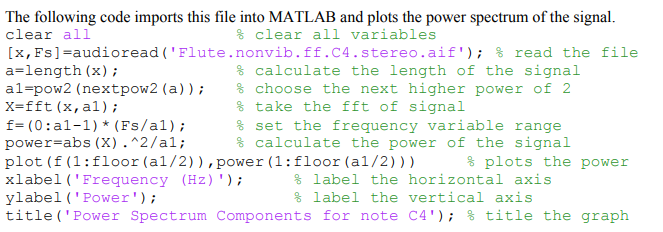
The following code imports this file into MATLAB and plots the power spectrum of the signal. clear all clear all variables ('Flute.nonvib.ff.C4.stereo.aif'); [x, Fs] =audioread a=length (x); al-pow2 (nextpow2 (a)); X=fft (x, al); f=(0:a1-1) * (Fs/al); power=abs(X).^2/a1; read the file calculate the length of the signal choose the next higher power of 2 take the fft of signal set the frequency variable range calculate the power of the signal plots the power plot (f (1: floor (a1/2)), power (1: floor (a1/2))) xlabel ('Frequency (Hz)'); % label the horizontal axis label the vertical axis ylabel ('Power'); title ('Power Spectrum Components for note C4'); % title the graph 4. (4) The musical note C4 corresponds to 261.63 Hz, how does the fundamental frequency from your graph compare to the actual frequency? What indication does this give you about the instrument - is it in-tune, slightly flat, very flat, slight sharp, or very sharp?
Step by Step Solution
3.43 Rating (162 Votes )
There are 3 Steps involved in it
I can guide you through the analysis 1 Identify the Fundamental Frequency Examine the power spectrum ... View full answer

Get step-by-step solutions from verified subject matter experts