

Question: The following contingency table provides a joint frequency distribution for the popular votes cast in the presidential election by region and political party. Data are
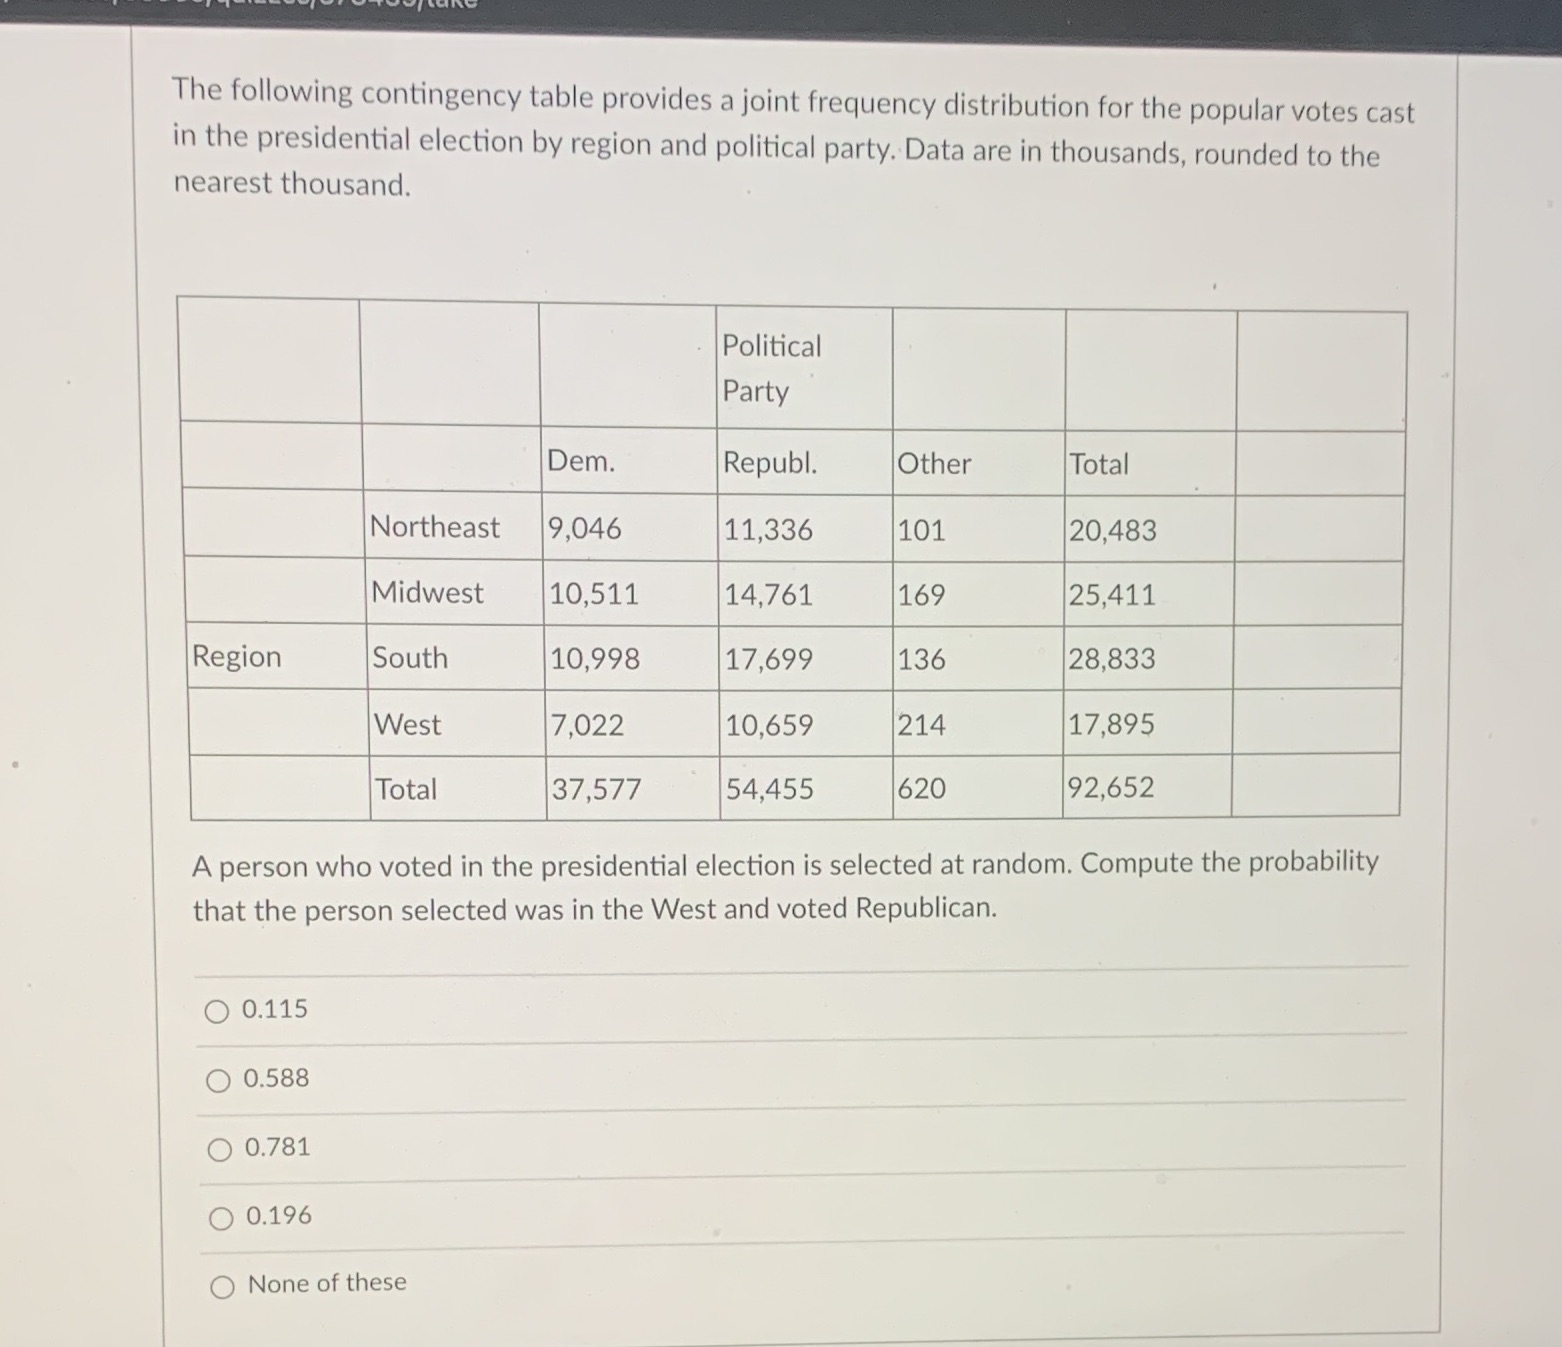
The following contingency table provides a joint frequency distribution for the popular votes cast in the presidential election by region and political party. Data are in thousands, rounded to the nearest thousand. Political Party Dem. Republ Other Total Northeast 9,046 11,336 101 20,483 Midwest 10,511 14,761 169 25,411 Region South 10,998 17,699 136 28,833 West 7,022 10,659 214 17,895 Total 37,577 54,455 620 92,652 A person who voted in the presidential election is selected at random. Compute the probability that the person selected was in the West and voted Republican. O 0.115 O 0.588 O 0.781 O 0.196 O None of these
Step by Step Solution
There are 3 Steps involved in it
1 Expert Approved Answer
Step: 1 Unlock

Question Has Been Solved by an Expert!
Get step-by-step solutions from verified subject matter experts
Step: 2 Unlock
Step: 3 Unlock