

Question: The following correlation matrix represents the relationship among variables that might be used to predict nursing student performance on the RN assessment test, which is

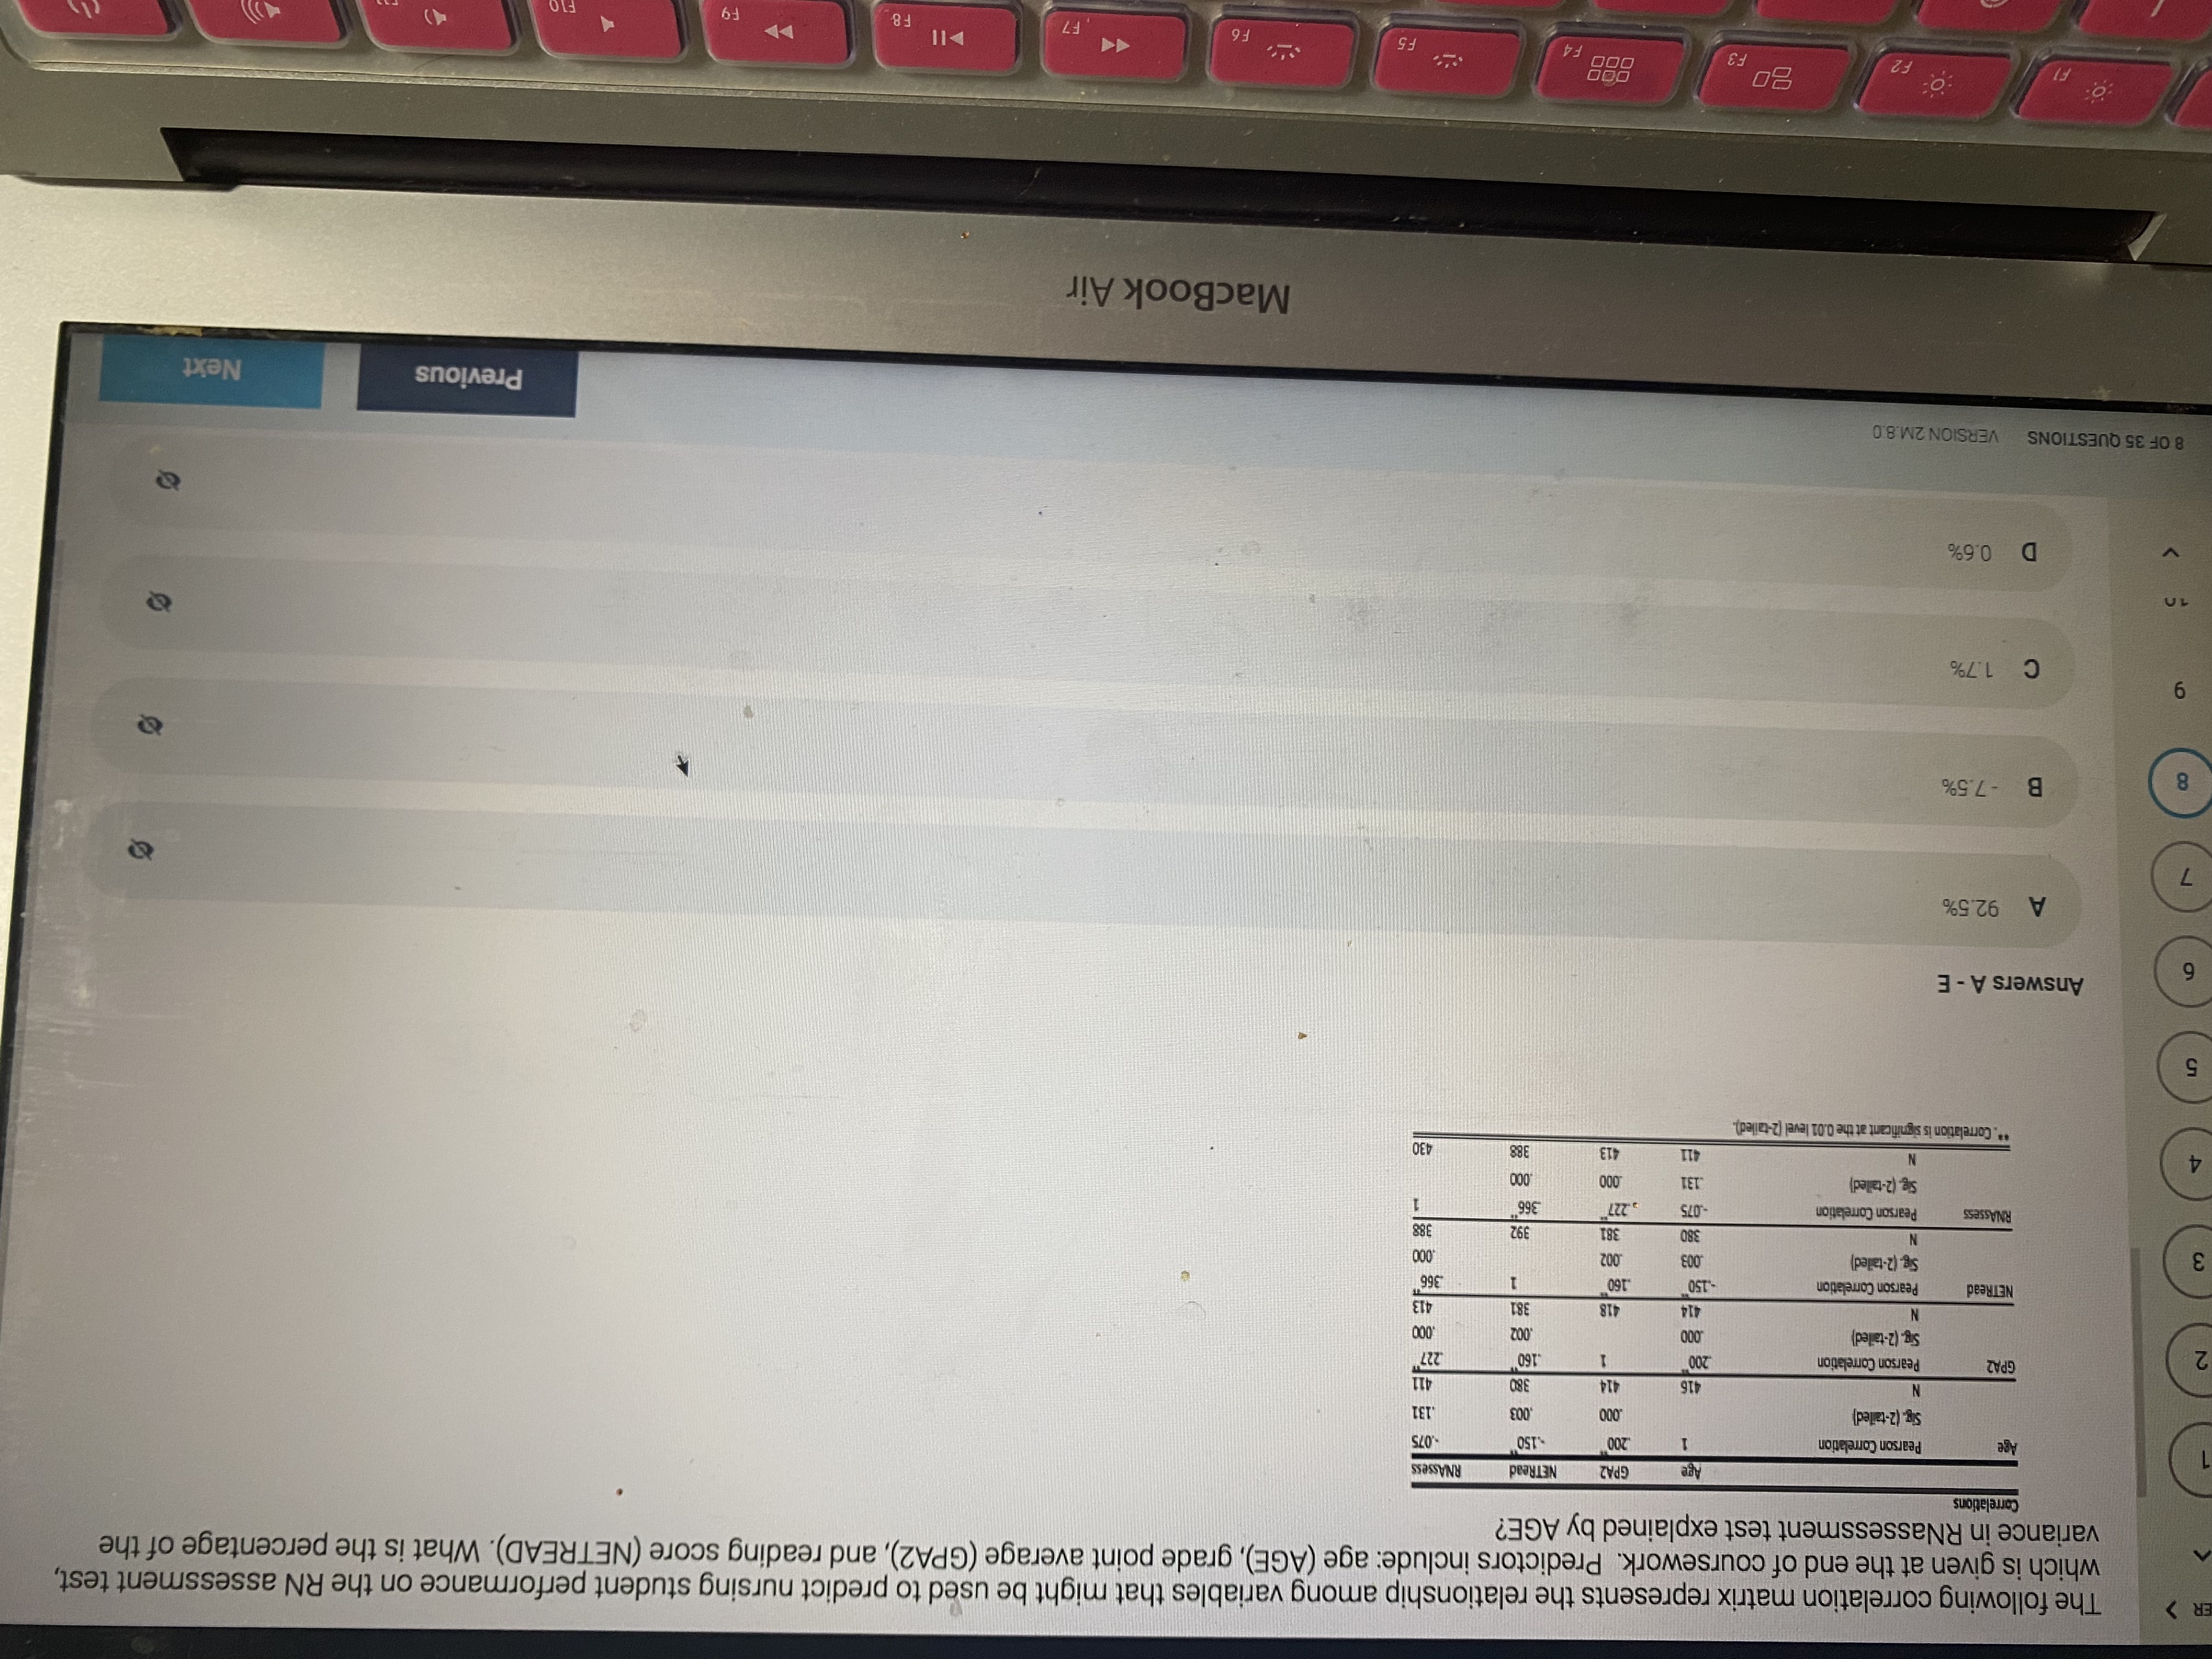
The following correlation matrix represents the relationship among variables that might be used to predict nursing student performance on the RN assessment test, which is given at the end of coursework. Predictors include: age (AGE), grade point average (GPA2), and reading score (NETREAD). What is the percentage of the variance in RNassessment test explained by AGE? Correlations Age GPAZ NETRead RNASSESS Pearson Correlation 200 -150 .075 Sig. (Z-tailed) .003 131 416 414 380 411 SPA2 Pearson Correlation 200 .160 227" Sig. (2-tailed) .000 .002 .000 414 418 381 413 NETRead Pearson Correlation -150 160 366" Sig. (2-tailed) -003 902 ,000 N 380 381 RNAssess Pearson Correlation - 075 131 000 8 8 2 sig. (2-tailed) 411 413 430 "Correlation is significant at the 0.01 level (2-tailed). Answers A - E A 92.5% B -7.5% 19 C in D 8 OF 35 QUESTIONS VERSION 2M.8.0 Previous Next MacBook Air F2 20 F3 F4 F5 F6 14 F7 F 8 DD
Step by Step Solution
There are 3 Steps involved in it

Get step-by-step solutions from verified subject matter experts