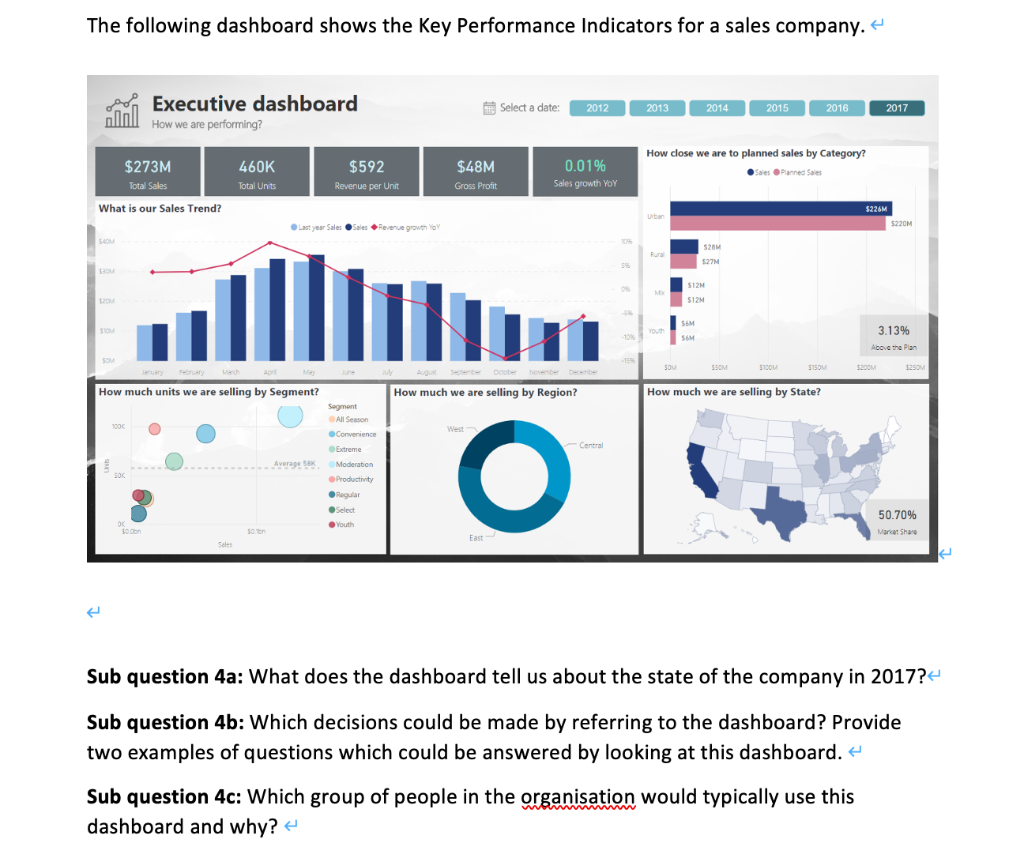
Question: The following dashboard shows the Key Performance Indicators for a sales company. + Select a date: a 2012 Executive dashboard How we are performing? ?

The following dashboard shows the Key Performance

The following dashboard shows the Key Performance Indicators for a sales company. + Select a date: a 2012 Executive dashboard How we are performing? ? 2013 2014 2015 2016 2017 How close we are to planned sales by Category? $273M Total Sales 460K Total Units $592 Revenue per Unit $48M Gross Profit 0.01% Sales growth YOY Sales Planned Sales What is our Sales Trend? Urban S226M 5220M Last year Sales Sales Revenue growth 528M Fural 527 56 512N . 512M IT SI You S6M SOM 3.13% -10 Above the Plan SOM SOU 550M 5100 $150 5200M $2501 How much units we are selling by Segment? How much we are selling by Region? How much we are selling by State? DOC West Central Averages Segment All Season Convenience Extreme Moderation Productivity Regular Select Youth 500 O oc 50.70% Maricar Share Soor East Sales Sub question 4a: What does the dashboard tell us about the state of the company in 2017? Sub question 4b: Which decisions could be made by referring to the dashboard? Provide two examples of questions which could be answered by looking at this dashboard. + Sub question 4c: Which group of people in the organisation would typically use this dashboard and why

Step by Step Solution

There are 3 Steps involved in it

1 Expert Approved Answer
Step: 1 Unlock blur-text-image
Question Has Been Solved by an Expert!

Get step-by-step solutions from verified subject matter experts

Step: 2 Unlock
Step: 3 Unlock

Students Have Also Explored These Related General Management Questions!