

Question: The following data apply: A pension fund manager is considering three mutual funds. The first is a stock fund, the second is a long-term bond
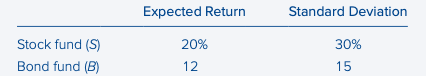
The following data apply: A pension fund manager is considering three mutual funds. The first is a stock fund, the second is a long-term bond fund, and the third is a money market fund that provides a safe return of 8%. The characteristics of the risky funds are as follows:

The correlation between the fund returns is .10.
Tabulate and draw the investment opportunity set of the two risky funds. Use investment proportions for the stock fund of 0% to 100% in increments of 20%.
Draw a tangent from the risk-free rate to the opportunity set. What does your graph show for the expected return and standard deviation of the optimal portfolio?
Solve numerically for the proportions of each asset and for the expected return and standard deviation of the optimal risky portfolio?
What is the Sharpe ratio of the best feasible CAL?
\begin{tabular}{lcc} & Expected Return & Standard Deviation \\ \hline Stock fund (S) & 20% & 30% \\ Bond fund (B) & 12 & 15 \end{tabular}
Step by Step Solution
There are 3 Steps involved in it

Get step-by-step solutions from verified subject matter experts