

Question: The following data apply to problems 3-7 A pension fund manager is considering three mutual funds. The first is a stock fund, the second is
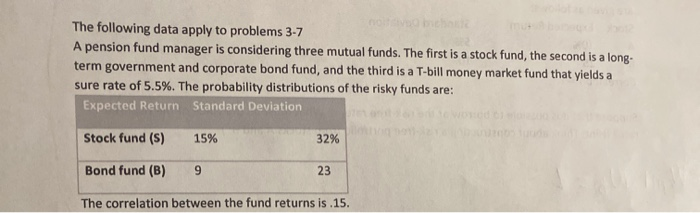

The following data apply to problems 3-7 A pension fund manager is considering three mutual funds. The first is a stock fund, the second is a long- term government and corporate bond fund, and the third is a T-bill money market fund that yields a sure rate of 5.5%. The probability distributions of the risky funds are: Expected Return Standard Deviation Stock fund (s) 15% 32% Bond fund (B) 9 23 The correlation between the fund returns is.15. 3. Tabulate and draw the investment opportunity set of the two risky funds. Use investment proportions for the stock fund of 0% to 100% in increments of 20%. What expected return and standard deviation does your graph show for the minimum-variance portfolio? (LO 6-2) 4. Draw a tangent from the risk-free rate to the opportunity set. What does your graph show for the expected return and standard deviation of the optimal risky portfolio? (LO 6-3)
Step by Step Solution
There are 3 Steps involved in it

Get step-by-step solutions from verified subject matter experts