

Question: The following data are from the CDC Wonder data on deaths in 2020. (See the Underlying Cause of Death data available there.) State Deaths Population

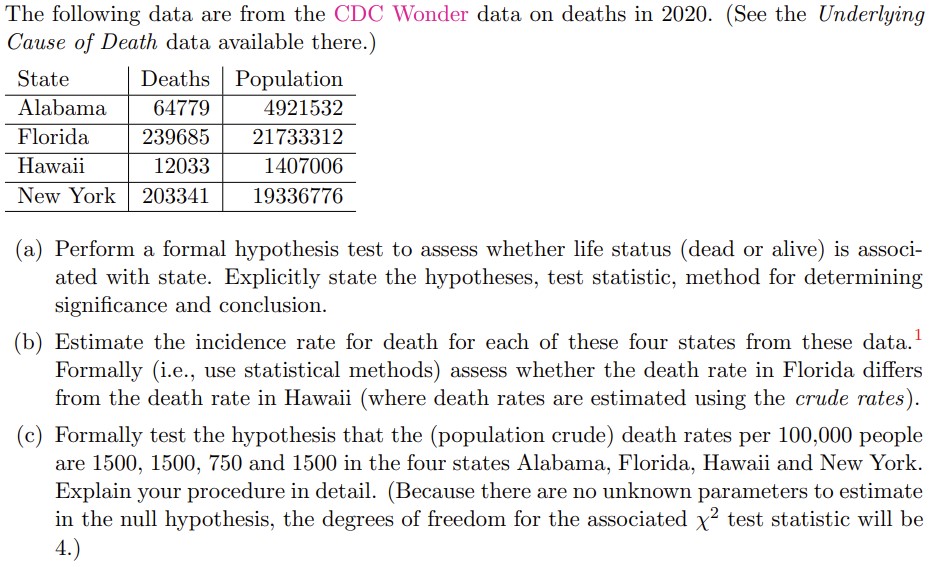
The following data are from the CDC Wonder data on deaths in 2020. (See the Underlying Cause of Death data available there.) State Deaths Population Alabama 4921532 Florida 21733312 Hawaii 1407005 New York 19336776 (a) Perform a formal hypothesis test to assess whether life status (dead or alive) is associ- ated with state. Explicitly state the hypotheses, test statistic, method for determining signicance and conclusion. (b) Estimate the incidence rate for death for each of these four states from these data.1 Formally (i.e., use statistical methods) assess whether the death rate in Florida differs from the death rate in Hawaii {where death rates are estimated using the crude rates). (c) Formally test the hypothesis that the (population crude) death rates per 100,000 people are 1500, 1500, 750 and 1500 in the four states Alabama, Florida, Hawaii and New York. Explain your procedure in detail. (Because there are no unknown parameters to estimate in the null hypothesis, the degrees of freedom for the associated x2 test statistic will be 4.}
Step by Step Solution
There are 3 Steps involved in it

Get step-by-step solutions from verified subject matter experts