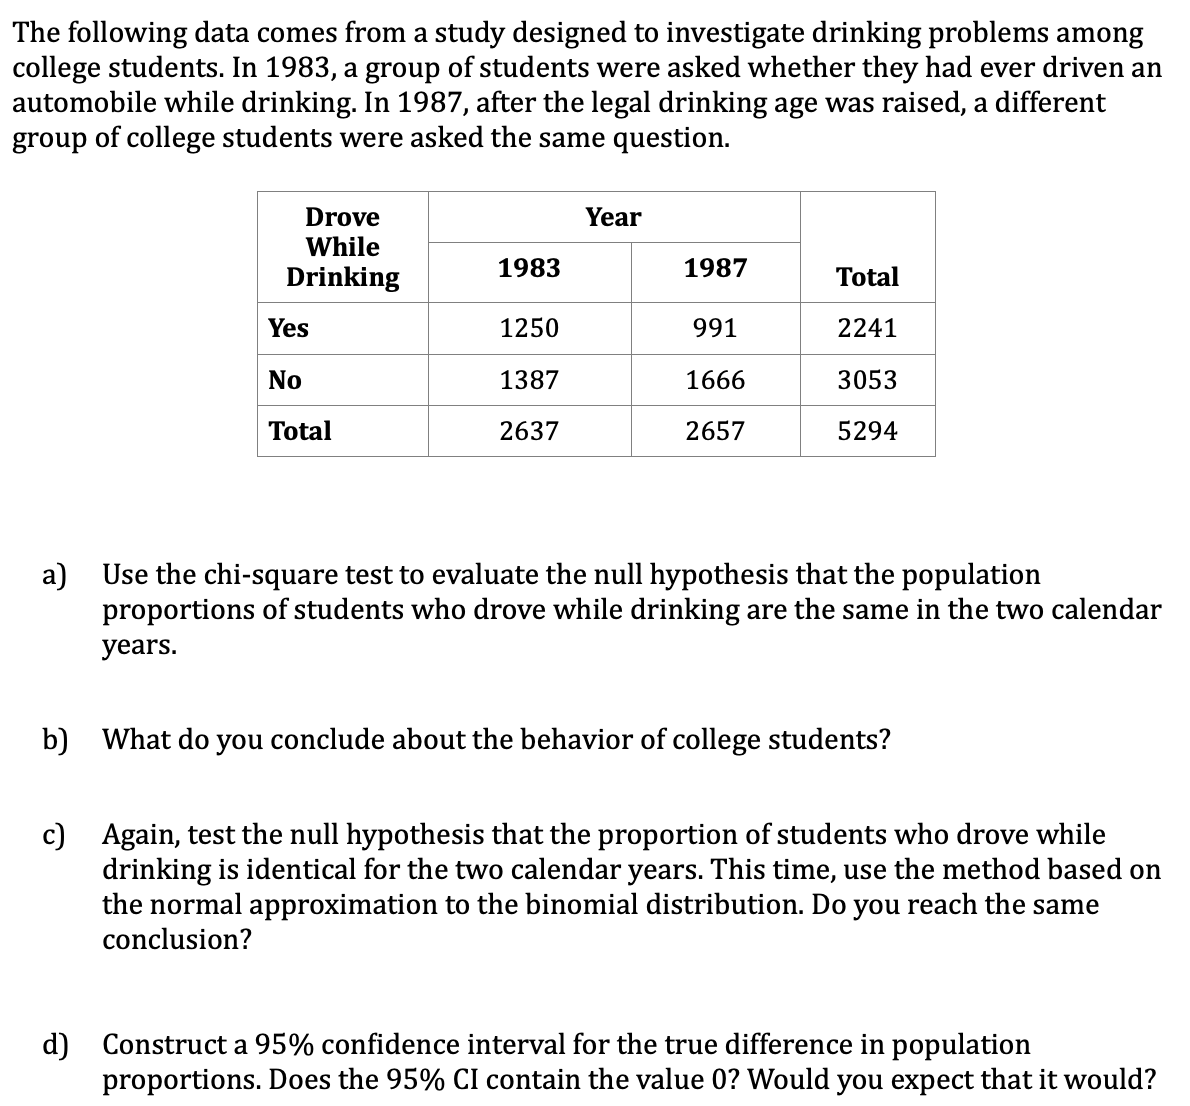
Question: The following data comes from a study designed to investigate drinking problems among college students. In 1983, a group of students were asked whether they

The following data comes from a study designed to
The following data comes from a study designed to investigate drinking problems among college students. In 1983, a group of students were asked whether they had ever driven an automobile while drinking. In 1987, after the legal drinking age was raised, a different group of college students were asked the same question. a) b) c) d) Drove Year While Drinking 1983 1987 Total Yes 1250 991 2241 No 1387 1666 3053 Total 2637 2657 5294 Use the chi-square test to evaluate the null hypothesis that the population proportions of students who drove while drinking are the same in the two calendar years. What do you conclude about the behavior of college students? Again, test the null hypothesis that the proportion of students who drove while drinking is identical for the two calendar years. This time, use the method based on the normal approximation to the binomial distribution. Do you reach the same conclusion? Construct a 95% confidence interval for the true difference in population proportions. Does the 95% CI contain the value 0? Would you expect that it would

Step by Step Solution

There are 3 Steps involved in it

1 Expert Approved Answer
Step: 1 Unlock blur-text-image
Question Has Been Solved by an Expert!

Get step-by-step solutions from verified subject matter experts

Step: 2 Unlock
Step: 3 Unlock

Students Have Also Explored These Related Mathematics Questions!