

Question: The following data is available for Alpha and Beta: Year 3 Alpha, Inc. Year 2 Year 1 Beta Corporation Year 3 Year 2 Year 1
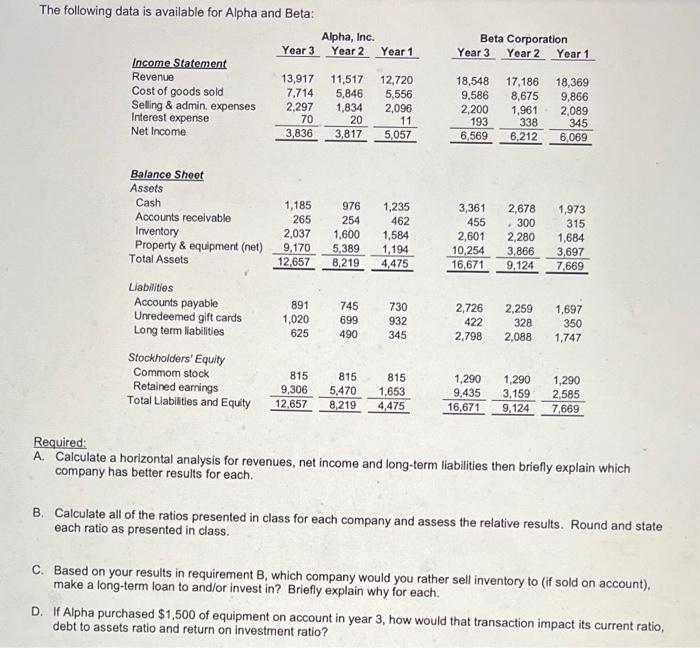
The following data is available for Alpha and Beta: Year 3 Alpha, Inc. Year 2 Year 1 Beta Corporation Year 3 Year 2 Year 1 Income Statement Revenue Cost of goods sold Selling & admin, expenses Interest expense Net Income 13,917 7,714 2,297 70 3,836 11,517 5,846 1,834 20 3,817 12,720 5,556 2,096 11 5,057 18,548 9,586 2,200 193 6,569 17,186 8,675 1,961 338 6,212 18,369 9,866 2,089 345 6,069 | Balance Shoot Assets Cash Accounts receivable Inventory Property & equipment (net) Total Assets 1,185 265 2,037 9,170 12,657 976 254 1,600 5,389 8,219 1,235 462 1,584 1,194 4,475 3,361 455 2,601 10,254 16,671 2,678 . 300 2,280 3,866 9,124 1,973 315 1,684 3,697 7,669 891 1,020 625 745 699 490 730 932 345 2,726 422 2,798 2,259 328 2,088 Liabilities Accounts payable Unredeemed gift cards Long term liabilities Stockholders' Equity Commom stock Retained earrings Total Liabilities and Equity 1,697 350 1,747 815 9,306 12,657 815 5,470 8,219 815 1,653 4,475 1,290 9,435 16,671 1,290 3,159 9,124 1,290 2,585 7,669 Required: A. Calculate a horizontal analysis for revenues, net income and long-term liabilities then briefly explain which company has better results for each. B. Calculate all of the ratios presented in class for each company and assess the relative results. Round and state each ratio as presented in class. C. Based on your results in requirement B, which company would you rather sell inventory to (if sold on account) make a long-term loan to and/or invest in? Briefly explain why for each. D. If Alpha purchased $1,500 of equipment on account in year 3, how would that transaction impact its current ratio, debt to assets ratio and return on investment ratio? The following data is available for Alpha and Beta: Year 3 Alpha, Inc. Year 2 Year 1 Beta Corporation Year 3 Year 2 Year 1 Income Statement Revenue Cost of goods sold Selling & admin, expenses Interest expense Net Income 13,917 7,714 2,297 70 3,836 11,517 5,846 1,834 20 3,817 12,720 5,556 2,096 11 5,057 18,548 9,586 2,200 193 6,569 17,186 8,675 1,961 338 6,212 18,369 9,866 2,089 345 6,069 | Balance Shoot Assets Cash Accounts receivable Inventory Property & equipment (net) Total Assets 1,185 265 2,037 9,170 12,657 976 254 1,600 5,389 8,219 1,235 462 1,584 1,194 4,475 3,361 455 2,601 10,254 16,671 2,678 . 300 2,280 3,866 9,124 1,973 315 1,684 3,697 7,669 891 1,020 625 745 699 490 730 932 345 2,726 422 2,798 2,259 328 2,088 Liabilities Accounts payable Unredeemed gift cards Long term liabilities Stockholders' Equity Commom stock Retained earrings Total Liabilities and Equity 1,697 350 1,747 815 9,306 12,657 815 5,470 8,219 815 1,653 4,475 1,290 9,435 16,671 1,290 3,159 9,124 1,290 2,585 7,669 Required: A. Calculate a horizontal analysis for revenues, net income and long-term liabilities then briefly explain which company has better results for each. B. Calculate all of the ratios presented in class for each company and assess the relative results. Round and state each ratio as presented in class. C. Based on your results in requirement B, which company would you rather sell inventory to (if sold on account) make a long-term loan to and/or invest in? Briefly explain why for each. D. If Alpha purchased $1,500 of equipment on account in year 3, how would that transaction impact its current ratio, debt to assets ratio and return on investment ratio
Step by Step Solution
There are 3 Steps involved in it

Get step-by-step solutions from verified subject matter experts