

Question: The following data is generated through a program: provide a summary of 2-3 paragraphs in which you address the following: Identify which variables have normally
The following data is generated through a program:
provide a summary of 2-3 paragraphs in which you address the following:
- Identify which variables have normally distributed data, if any, based on your visual inspection of the histograms.
- Identify which variables do not have normally distributed data, if any, based on the histograms.
- Identify and explain any characteristics relating to the data that could cause it to be skewed (if it is not normally distributed). For example, were there outliers? If so, what were they? What could be done with the data to remove them?
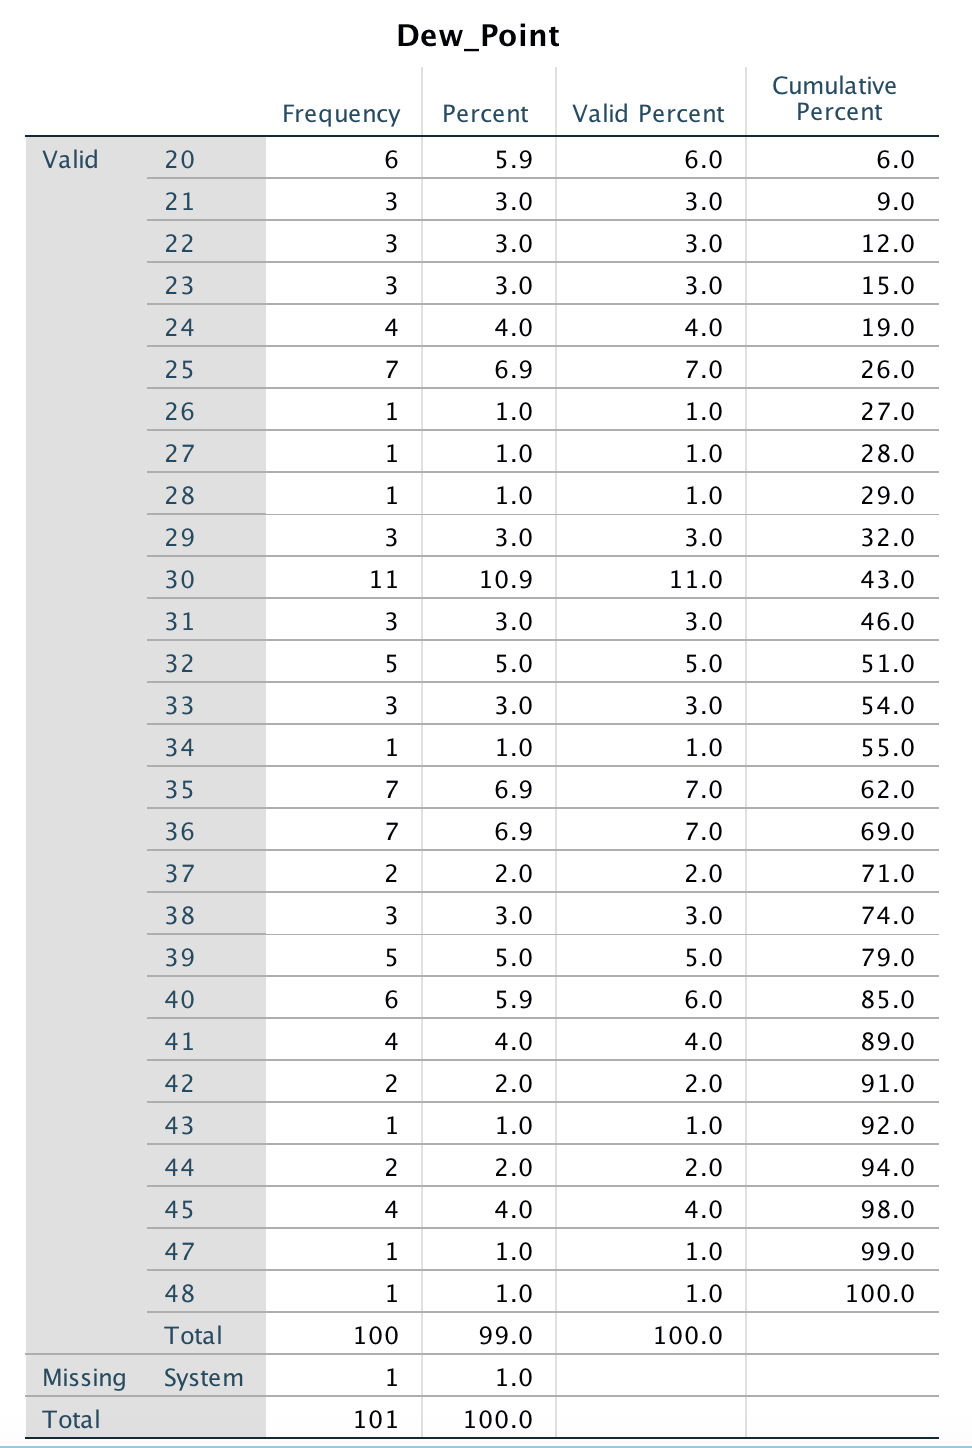
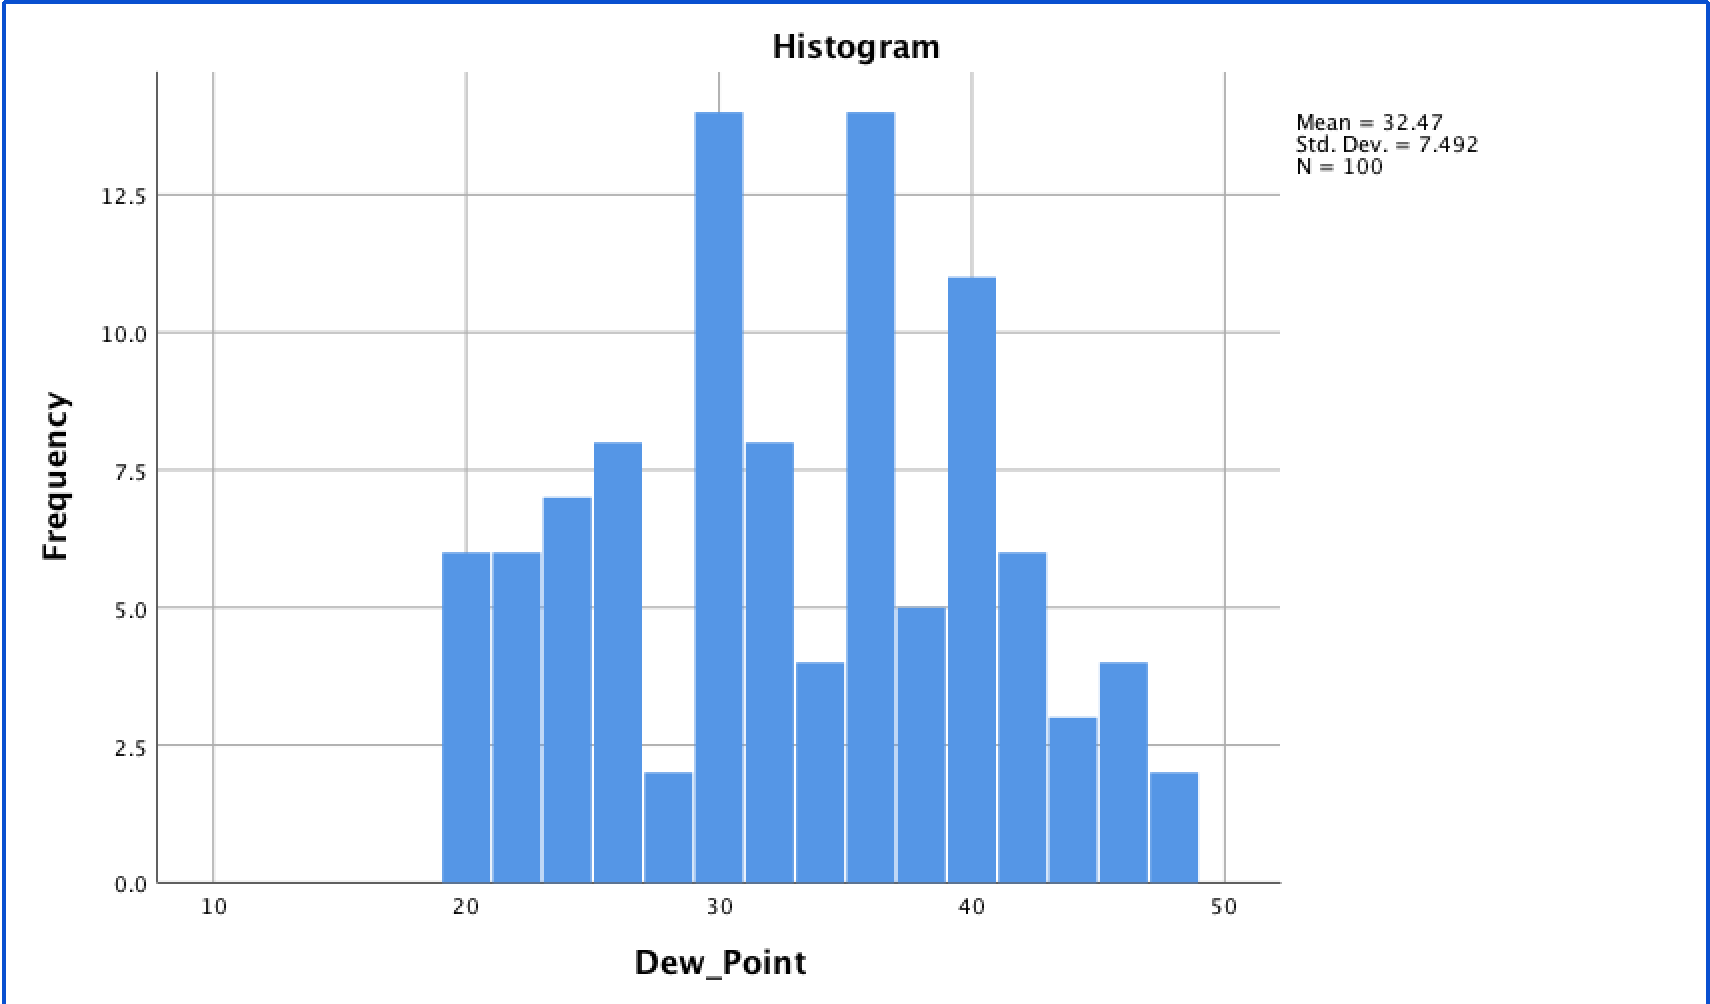
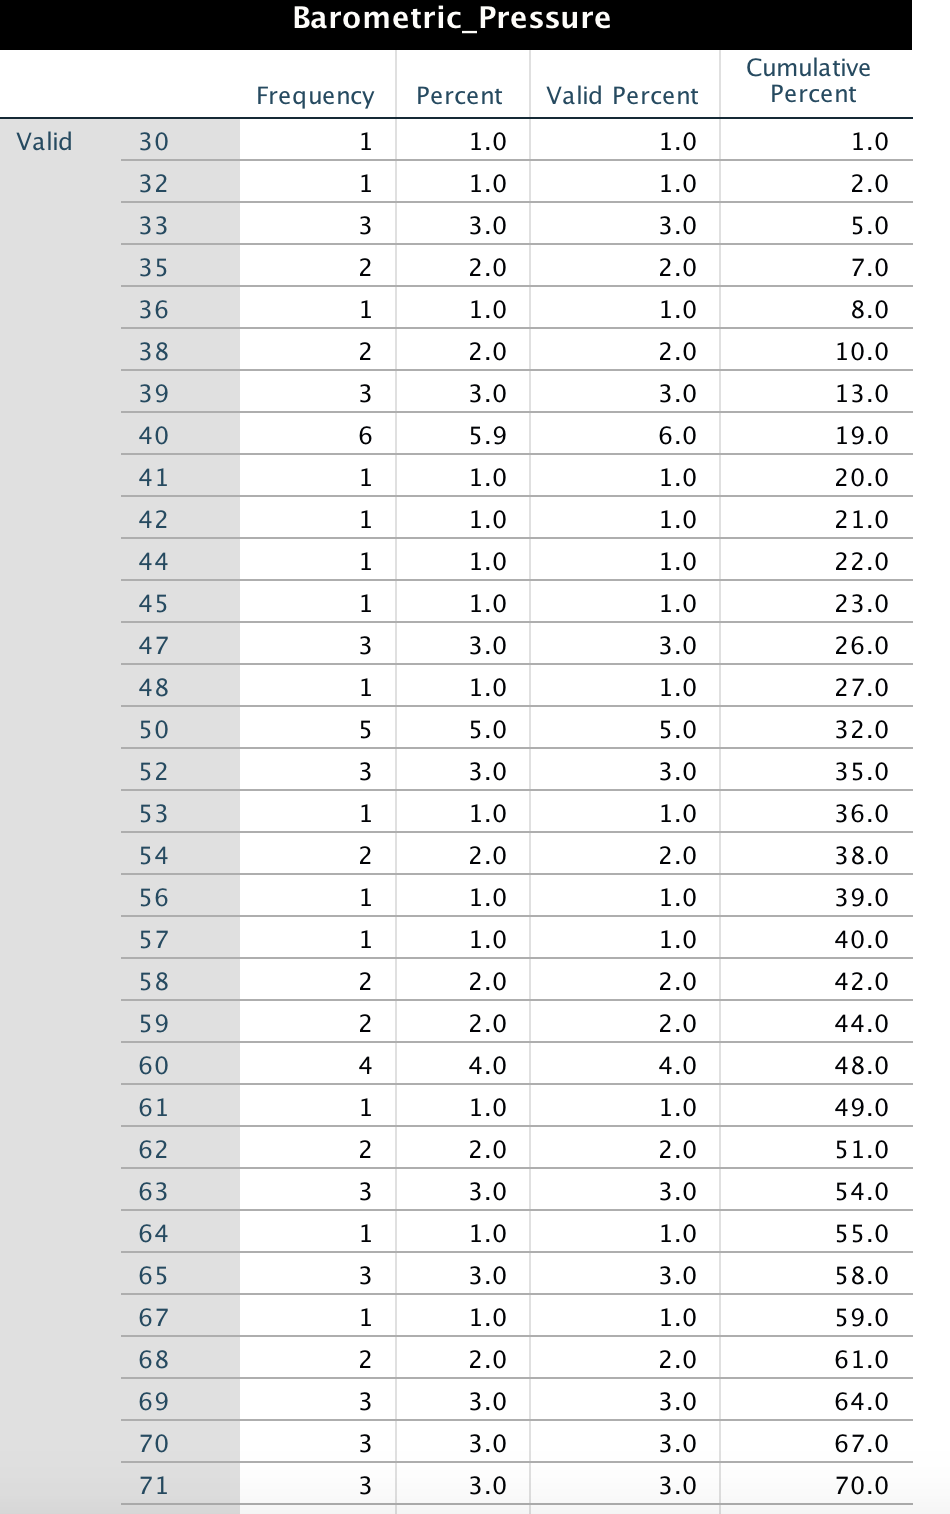
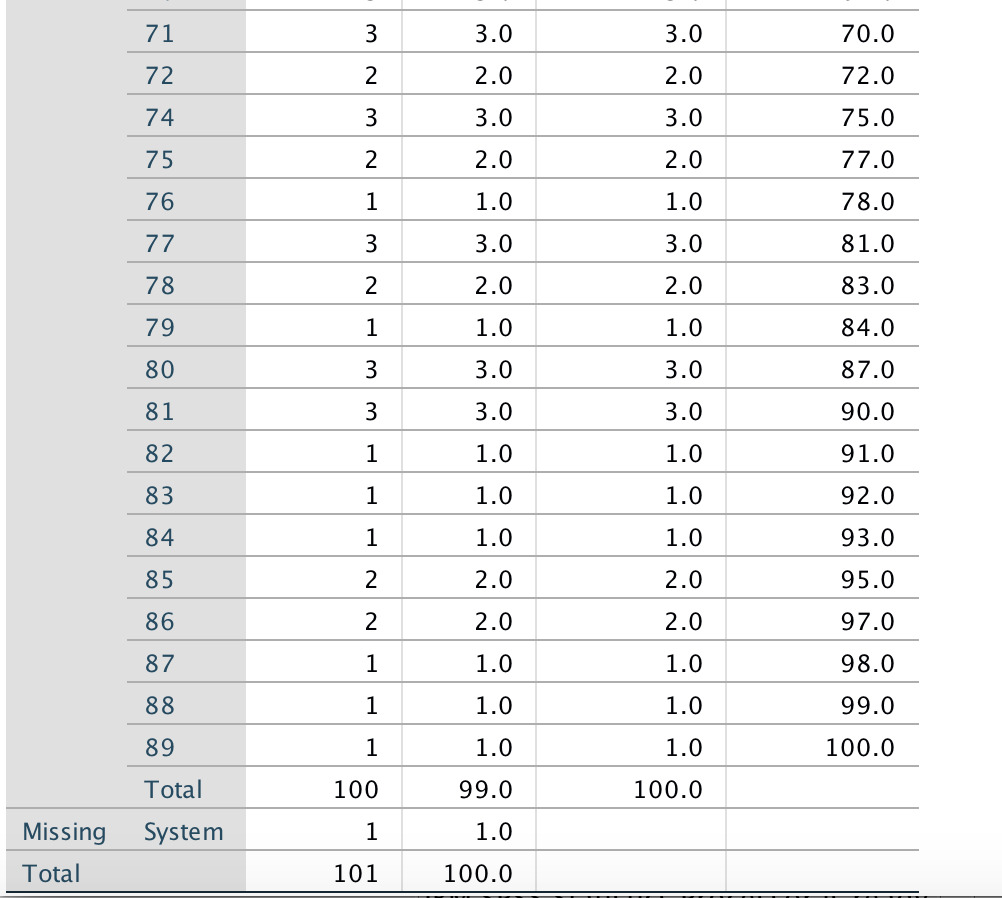
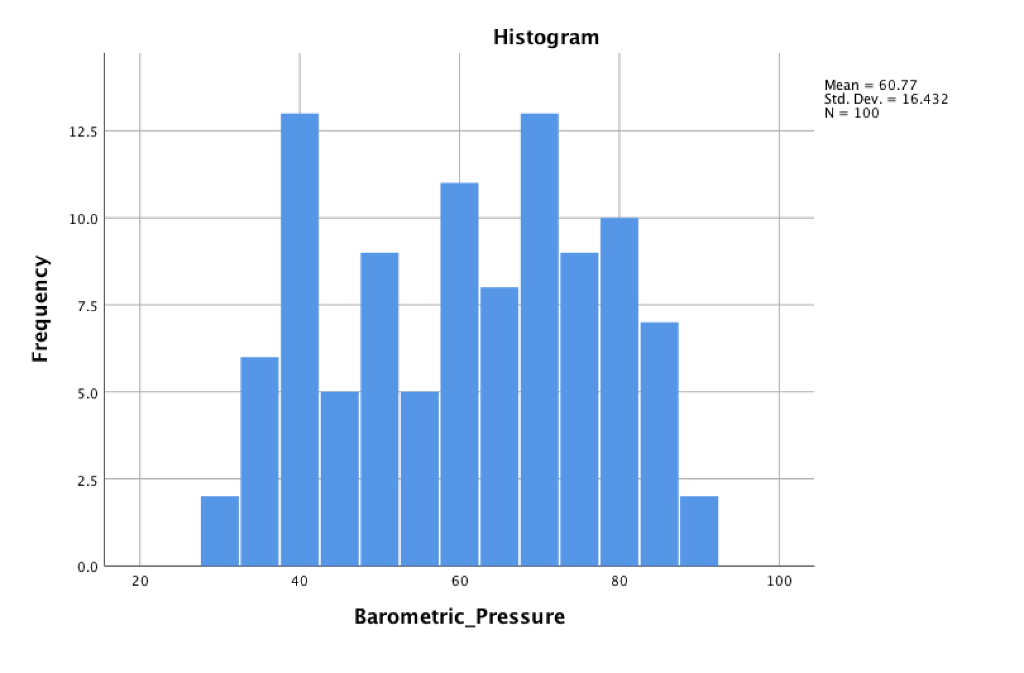
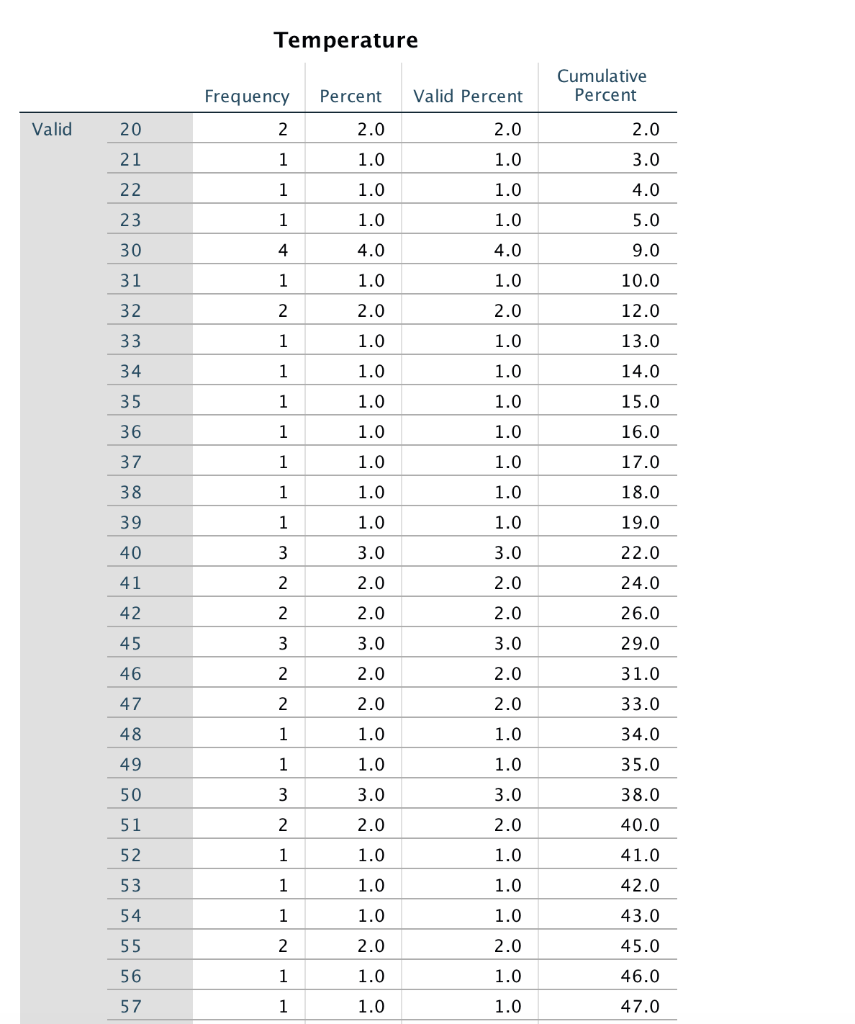
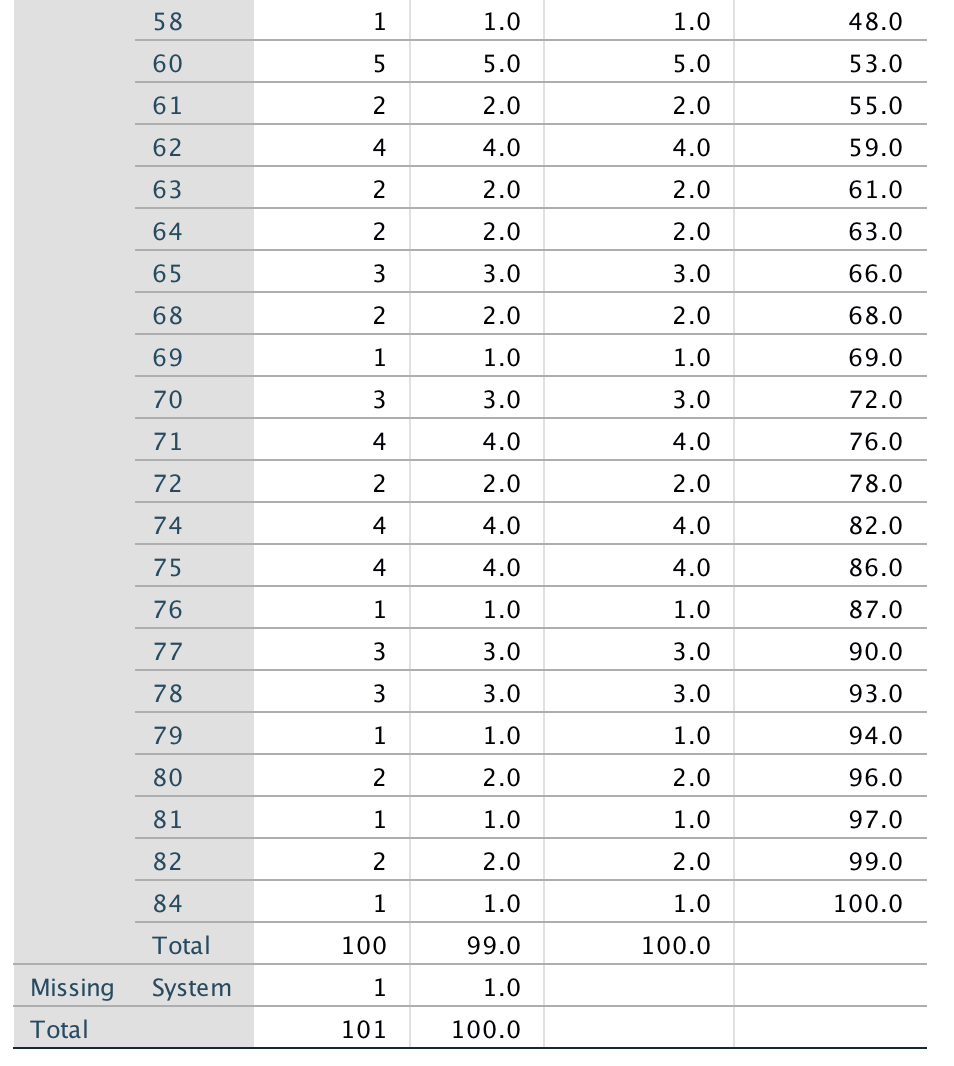
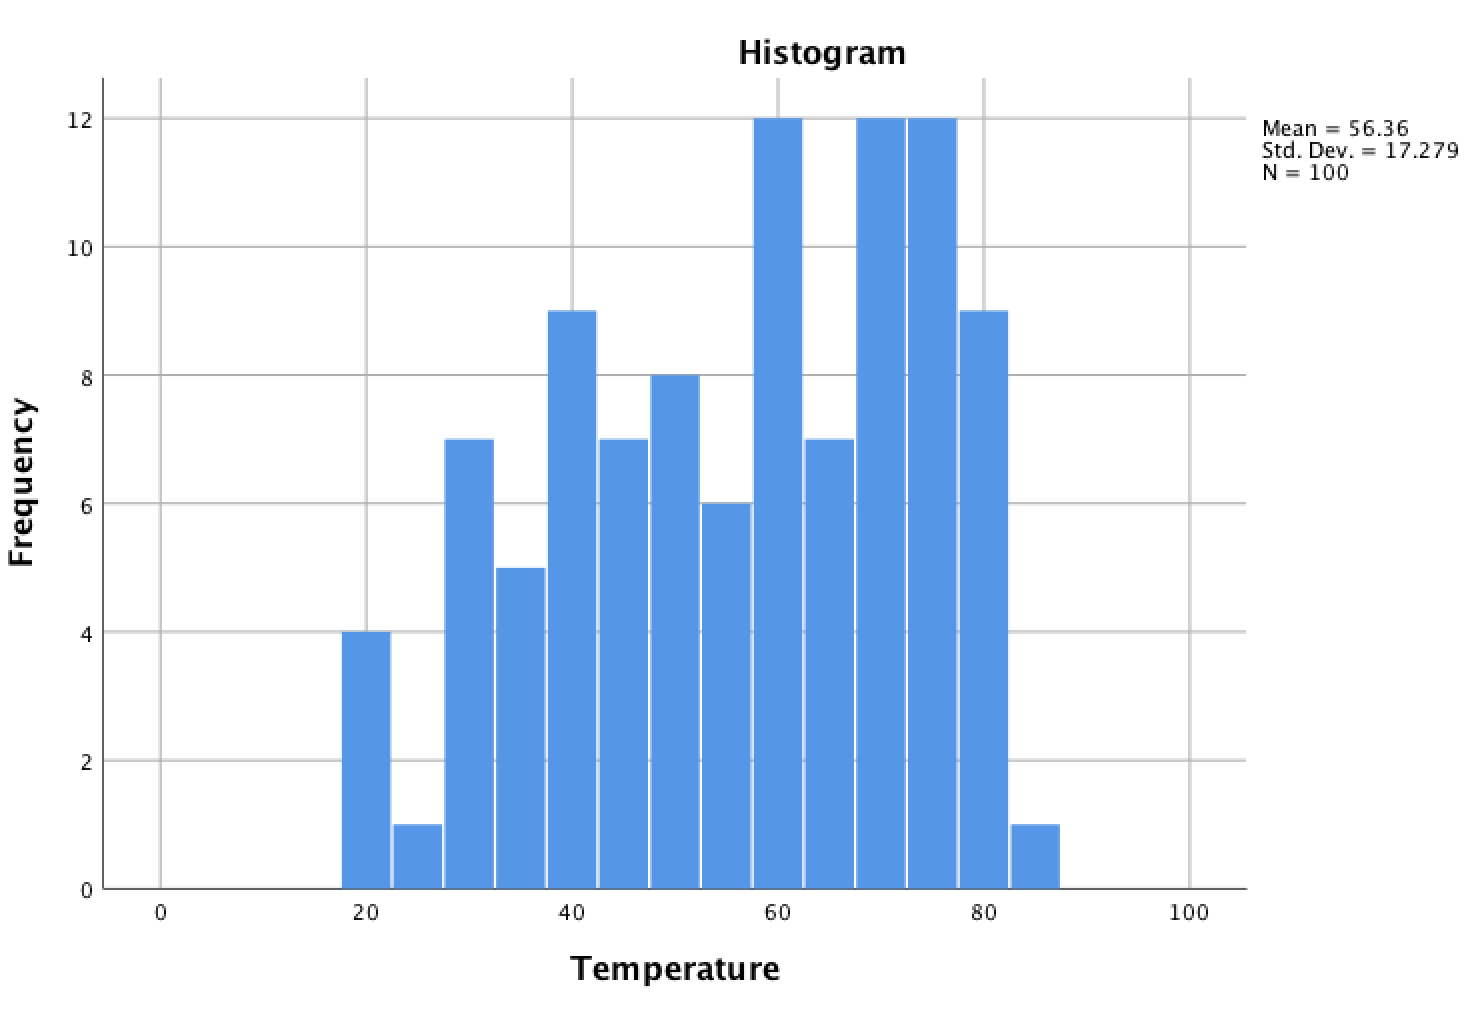
Dew_Point Cumulative Percent Frequency Percent Valid Percent Valid 20 6 5.9 6.0 6.0 21 3 3.0 3.0 9.0 22 3 3.0 3.0 12.0 23 3 3.0 3.0 15.0 24 4. 4.0 4.0 19.0 25 7 6.9 7.0 26.0 26 1 1.0 1.0 27.0 27 1 1.0 1.0 28.0 28 1 1.0 1.0 29.0 29 3 3.0 3.0 32.0 30 11 10.9 11.0 43.0 31 3 3.0 3.0 46.0 32 5 5.0 5.0 51.0 33 3 3.0 3.0 54.0 34 1 1.0 1.0 55.0 35 7 6.9 7.0 62.0 36 7 6.9 7.0 69.0 37 2 2.0 2.0 71.0 38 3 3.0 3.0 74.0 39 5 5.0 5.0 79.0 40 6 5.9 6.0 85.0 41 4 4.0 4.0 89.0 42 2 2.0 2.0 91.0 43 1 1.0 1.0 92.0 44 2 2.0 2.0 94.0 98.0 45 4 4.0 4.0 47 1 1.0 1.0 99.0 48 1 1.0 1.0 100.0 Total 100 99.0 100.0 Missing System 1 1.0 Total 101 100.0 Histogram Mean = 32.47 Std. Dev. = 7.492 N = 100 12.5 10.0 Frequency 7.5 5.0 2.5 0.0 10 20 30 40 50 Dew_Point Barometric_Pressure Cumulative Percent Frequency Percent Valid Percent Valid 30 1 1.0 1.0 1.0 32 1 1.0 1.0 2.0 33 3 3.0 3.0 5.0 35 2 2.0 2.0 7.0 36 1 1.0 1.0 8.0 38 2 2.0 2.0 10.0 39 3 3.0 3.0 13.0 40 6 5.9 6.0 19.0 41 1 1.0 1.0 20.0 42 1 1.0 1.0 21.0 44 1 1.0 1.0 22.0 45 1 1.0 1.0 23.0 47 3 3.0 3.0 26.0 48 1 1.0 1.0 27.0 50 5 5.0 5.0 32.0 52 3 3.0 3.0 35.0 53 1 1.0 1.0 36.0 54 2 2.0 2.0 38.0 56 1 1.0 1.0 39.0 57 1 1.0 1.0 40.0 58 2 2.0 2.0 42.0 59 2 2.0 2.0 44.0 60 4 4.0 4.0 48.0 61 1 1.0 1.0 49.0 62 2 2.0 2.0 51.0 63 3 3.0 3.0 54.0 64 1 1.0 1.0 55.0 65 3 3.0 3.0 58.0 67 1 1.0 1.0 59.0 68 2 2.0 2.0 61.0 69 3 3.0 3.0 64.0 70 3 3.0 3.0 67.0 71 3 3.0 3.0 70.0 71 3 3.0 3.0 70.0 72 2 2.0 2.0 72.0 74 3 3.0 3.0 75.0 75 2 2.0 2.0 77.0 76 1 1.0 1.0 78.0 77 3 3.0 3.0 81.0 78 2 2.0 2.0 83.0 79 1 1.0 1.0 84.0 80 3 3.0 3.0 87.0 81 3 3.0 3.0 90.0 82 1 1.0 1.0 91.0 83 1 1.0 1.0 92.0 84 1 1.0 1.0 93.0 85 2 2.0 2.0 95.0 86 2 2.0 2.0 97.0 87 1 1.0 1.0 98.0 88 1 1.0 1.0 99.0 89 1 1.0 1.0 100.0 Total 100 99.0 100.0 System 1 1.0 Missing Total 101 100.0 Histogram Mean = 60.77 Std. Dev. = 16.432 N = 100 12.5 10.0 Frequency 7.5 5.0 2.5 0.0 20 40 60 80 100 Barometric_Pressure Temperature Cumulative Percent Frequency Percent Valid Percent Valid 20 2 2.0 2.0 2.0 21 1 1.0 1.0 3.0 22 1 1.0 1.0 4.0 23 1 1.0 1.0 5.0 30 4 4.0 4.0 9.0 31 1 1.0 1.0 10.0 32 2 2.0 2.0 12.0 33 1 1.0 1.0 13.0 34 1.0 1.0 14.0 35 1.0 1.0 15.0 1 1 1.0 1.0 16.0 36 37 1 1.0 1.0 17.0 1.0 1.0 18.0 38 39 1 1.0 1.0 19.0 40 3 3.0 3.0 22.0 41 2 24.0 2.0 2.0 2.0 2.0 42 2 26.0 45 3 3.0 3.0 29.0 46 2 2.0 2.0 31.0 47 2 2.0 2.0 33.0 48 1 1.0 34.0 1.0 1.0 49 1 35.0 1.0 3.0 50 3 3.0 38.0 51 2 2.0 2.0 40.0 52 1 1.0 1.0 41.0 53 1 1.0 1.0 42.0 54 1 1.0 1.0 43.0 55 2 2.0 2.0 45.0 56 1 1.0 1.0 46.0 57 1 1.0 1.0 47.0 58 1 1.0 1.0 48.0 60 5 5.0 5.0 53.0 61 2 2.0 2.0 55.0 62 4 4.0 4.0 59.0 63 2 2.0 2.0 61.0 64 2 2.0 2.0 63.0 65 3 3.0 3.0 66.0 68 2 2.0 2.0 68.0 69 1 1.0 1.0 69.0 70 3 3.0 3.0 72.0 71 4 4.0 4.0 76.0 72 2 2.0 2.0 78.0 74 4 4.0 4.0 82.0 75 4 4.0 4.0 86.0 76 1 1.0 1.0 87.0 77 3 3.0 3.0 90.0 78 3 3.0 3.0 93.0 79 1 1.0 1.0 94.0 80 2 2.0 2.0 96.0 81 1 1.0 97.0 1.0 2.0 82 2 2.0 99.0 84 1 1.0 1.0 100.0 Total 100 99.0 100.0 System 1 1.0 Missing Total 101 100.0 Histogram 12 Mean = 56.36 Std. Dev. = 17.279 N = 100 10 Frequency 4 2 0 20 40 60 80 100 Temperature Dew_Point Cumulative Percent Frequency Percent Valid Percent Valid 20 6 5.9 6.0 6.0 21 3 3.0 3.0 9.0 22 3 3.0 3.0 12.0 23 3 3.0 3.0 15.0 24 4. 4.0 4.0 19.0 25 7 6.9 7.0 26.0 26 1 1.0 1.0 27.0 27 1 1.0 1.0 28.0 28 1 1.0 1.0 29.0 29 3 3.0 3.0 32.0 30 11 10.9 11.0 43.0 31 3 3.0 3.0 46.0 32 5 5.0 5.0 51.0 33 3 3.0 3.0 54.0 34 1 1.0 1.0 55.0 35 7 6.9 7.0 62.0 36 7 6.9 7.0 69.0 37 2 2.0 2.0 71.0 38 3 3.0 3.0 74.0 39 5 5.0 5.0 79.0 40 6 5.9 6.0 85.0 41 4 4.0 4.0 89.0 42 2 2.0 2.0 91.0 43 1 1.0 1.0 92.0 44 2 2.0 2.0 94.0 98.0 45 4 4.0 4.0 47 1 1.0 1.0 99.0 48 1 1.0 1.0 100.0 Total 100 99.0 100.0 Missing System 1 1.0 Total 101 100.0 Histogram Mean = 32.47 Std. Dev. = 7.492 N = 100 12.5 10.0 Frequency 7.5 5.0 2.5 0.0 10 20 30 40 50 Dew_Point Barometric_Pressure Cumulative Percent Frequency Percent Valid Percent Valid 30 1 1.0 1.0 1.0 32 1 1.0 1.0 2.0 33 3 3.0 3.0 5.0 35 2 2.0 2.0 7.0 36 1 1.0 1.0 8.0 38 2 2.0 2.0 10.0 39 3 3.0 3.0 13.0 40 6 5.9 6.0 19.0 41 1 1.0 1.0 20.0 42 1 1.0 1.0 21.0 44 1 1.0 1.0 22.0 45 1 1.0 1.0 23.0 47 3 3.0 3.0 26.0 48 1 1.0 1.0 27.0 50 5 5.0 5.0 32.0 52 3 3.0 3.0 35.0 53 1 1.0 1.0 36.0 54 2 2.0 2.0 38.0 56 1 1.0 1.0 39.0 57 1 1.0 1.0 40.0 58 2 2.0 2.0 42.0 59 2 2.0 2.0 44.0 60 4 4.0 4.0 48.0 61 1 1.0 1.0 49.0 62 2 2.0 2.0 51.0 63 3 3.0 3.0 54.0 64 1 1.0 1.0 55.0 65 3 3.0 3.0 58.0 67 1 1.0 1.0 59.0 68 2 2.0 2.0 61.0 69 3 3.0 3.0 64.0 70 3 3.0 3.0 67.0 71 3 3.0 3.0 70.0 71 3 3.0 3.0 70.0 72 2 2.0 2.0 72.0 74 3 3.0 3.0 75.0 75 2 2.0 2.0 77.0 76 1 1.0 1.0 78.0 77 3 3.0 3.0 81.0 78 2 2.0 2.0 83.0 79 1 1.0 1.0 84.0 80 3 3.0 3.0 87.0 81 3 3.0 3.0 90.0 82 1 1.0 1.0 91.0 83 1 1.0 1.0 92.0 84 1 1.0 1.0 93.0 85 2 2.0 2.0 95.0 86 2 2.0 2.0 97.0 87 1 1.0 1.0 98.0 88 1 1.0 1.0 99.0 89 1 1.0 1.0 100.0 Total 100 99.0 100.0 System 1 1.0 Missing Total 101 100.0 Histogram Mean = 60.77 Std. Dev. = 16.432 N = 100 12.5 10.0 Frequency 7.5 5.0 2.5 0.0 20 40 60 80 100 Barometric_Pressure Temperature Cumulative Percent Frequency Percent Valid Percent Valid 20 2 2.0 2.0 2.0 21 1 1.0 1.0 3.0 22 1 1.0 1.0 4.0 23 1 1.0 1.0 5.0 30 4 4.0 4.0 9.0 31 1 1.0 1.0 10.0 32 2 2.0 2.0 12.0 33 1 1.0 1.0 13.0 34 1.0 1.0 14.0 35 1.0 1.0 15.0 1 1 1.0 1.0 16.0 36 37 1 1.0 1.0 17.0 1.0 1.0 18.0 38 39 1 1.0 1.0 19.0 40 3 3.0 3.0 22.0 41 2 24.0 2.0 2.0 2.0 2.0 42 2 26.0 45 3 3.0 3.0 29.0 46 2 2.0 2.0 31.0 47 2 2.0 2.0 33.0 48 1 1.0 34.0 1.0 1.0 49 1 35.0 1.0 3.0 50 3 3.0 38.0 51 2 2.0 2.0 40.0 52 1 1.0 1.0 41.0 53 1 1.0 1.0 42.0 54 1 1.0 1.0 43.0 55 2 2.0 2.0 45.0 56 1 1.0 1.0 46.0 57 1 1.0 1.0 47.0 58 1 1.0 1.0 48.0 60 5 5.0 5.0 53.0 61 2 2.0 2.0 55.0 62 4 4.0 4.0 59.0 63 2 2.0 2.0 61.0 64 2 2.0 2.0 63.0 65 3 3.0 3.0 66.0 68 2 2.0 2.0 68.0 69 1 1.0 1.0 69.0 70 3 3.0 3.0 72.0 71 4 4.0 4.0 76.0 72 2 2.0 2.0 78.0 74 4 4.0 4.0 82.0 75 4 4.0 4.0 86.0 76 1 1.0 1.0 87.0 77 3 3.0 3.0 90.0 78 3 3.0 3.0 93.0 79 1 1.0 1.0 94.0 80 2 2.0 2.0 96.0 81 1 1.0 97.0 1.0 2.0 82 2 2.0 99.0 84 1 1.0 1.0 100.0 Total 100 99.0 100.0 System 1 1.0 Missing Total 101 100.0 Histogram 12 Mean = 56.36 Std. Dev. = 17.279 N = 100 10 Frequency 4 2 0 20 40 60 80 100 Temperature
Step by Step Solution
There are 3 Steps involved in it

Get step-by-step solutions from verified subject matter experts