

Question: The following data represent baseball batting averages for a random sample of National League players near the end of the baseball season 195 126 0
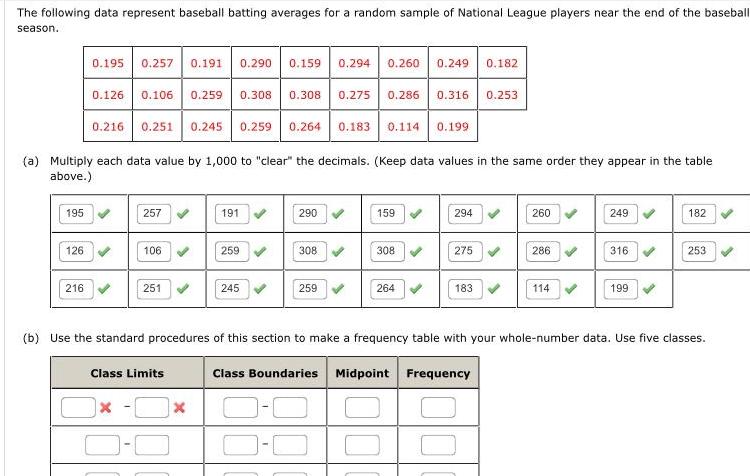

The following data represent baseball batting averages for a random sample of National League players near the end of the baseball season 195 126 0 195 0 257 0 191 0 290 0 159 0 294 216 0 126 0 106 0 259 0 308 0 308 0 275 0 216 0 251 0 245 0 259 0 264 0 183 a Multiply each data value by 1 000 to clear the decimals Keep data values in the same order they appear in the table above 257 106 X 251 Class Limits 191 X 259 245 290 308 259 0 260 0 249 0 182 0 286 0 316 0 253 0 114 0 199 159 308 264 100 294 275 183 Class Boundaries Midpoint Frequency 260 286 114 b Use the standard procedures of this section to make a frequency table with your whole number data Use five classes 249 316 199 182 253
Step by Step Solution
There are 3 Steps involved in it

Get step-by-step solutions from verified subject matter experts