

Question: The following data represent selected information from the comparative income statement and balance sheet for Hot Rolled Corporation for the years ended December 31, 2017
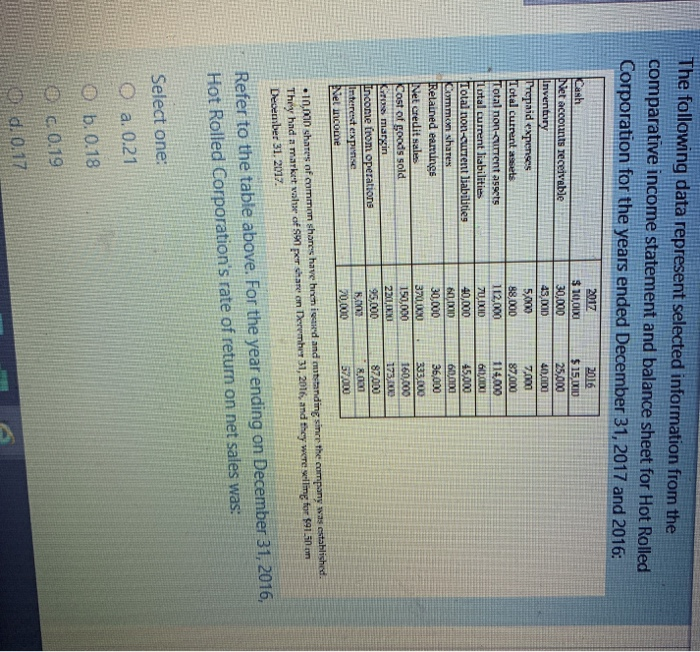
The following data represent selected information from the comparative income statement and balance sheet for Hot Rolled Corporation for the years ended December 31, 2017 and 2016: Kash Net accounts receivable Inventory Trepaid expenses Total current ass Total non-sittent assets Lutal current liabilities Total non-current liabilities Kayman Nhares Relained eamings Net credit sales Cost of goods sold Kromargin Income from operations Interest expense Net income 2017 $ 100,000 30,000 43, DOD 5,000 88,000 112,000 70,1XID 40,000 60,000 30,000 37000 150,000 2211,00 95,000 Roma 20.000 2016 $ 15,000 25,000 40,000 7,000 87.000 114,000 600,000 45,000 60,000 36,000 333.000 160,000 173.100 87,000 8.030 57.000 10,000 shares of common shares have been issued and motstanding since the company was established. They had a market value of per share on Derumber 31, 2016, and they were selling for $91.50 m December 31, 2017 Refer to the table above. For the year ending on December 31, 2016, Hot Rolled Corporation's rate of return on net sales was: Select one: a. 0.21 O b. 0.18 c. 0.19 d. 0.17
Step by Step Solution
There are 3 Steps involved in it

Get step-by-step solutions from verified subject matter experts