

Question: The following data represent the chemistry grades for a random sample of 12 freshmen at a certain college along with their scores on an
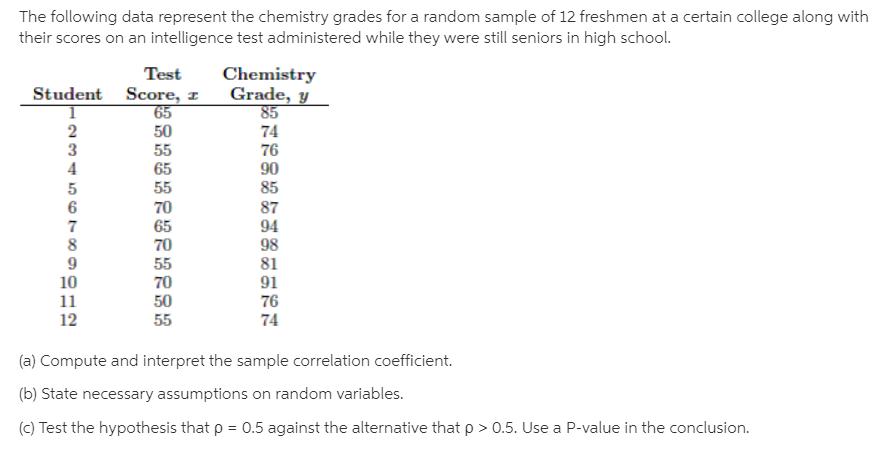
The following data represent the chemistry grades for a random sample of 12 freshmen at a certain college along with their scores on an intelligence test administered while they were still seniors in high school. Test Chemistry Student Score, z 65 50 Grade, y 85 2 3 74 76 90 85 55 65 55 70 65 70 87 94 98 81 91 7 8 55 70 50 10 11 76 12 55 74 (a) Compute and interpret the sample correlation coefficient. (b) State necessary assumptions on random variables. (c) Test the hypothesis that p = 0.5 against the alternative that p > 0.5. Use a P-value in the conclusion. %3D
Step by Step Solution
3.33 Rating (153 Votes )
There are 3 Steps involved in it

Get step-by-step solutions from verified subject matter experts