

Question: The following data represent the dividend yields (in 0.67 0.33 1.45 1.28 0.36 2.88 0 percent) of a random sample of 28 publicly traded 2.7
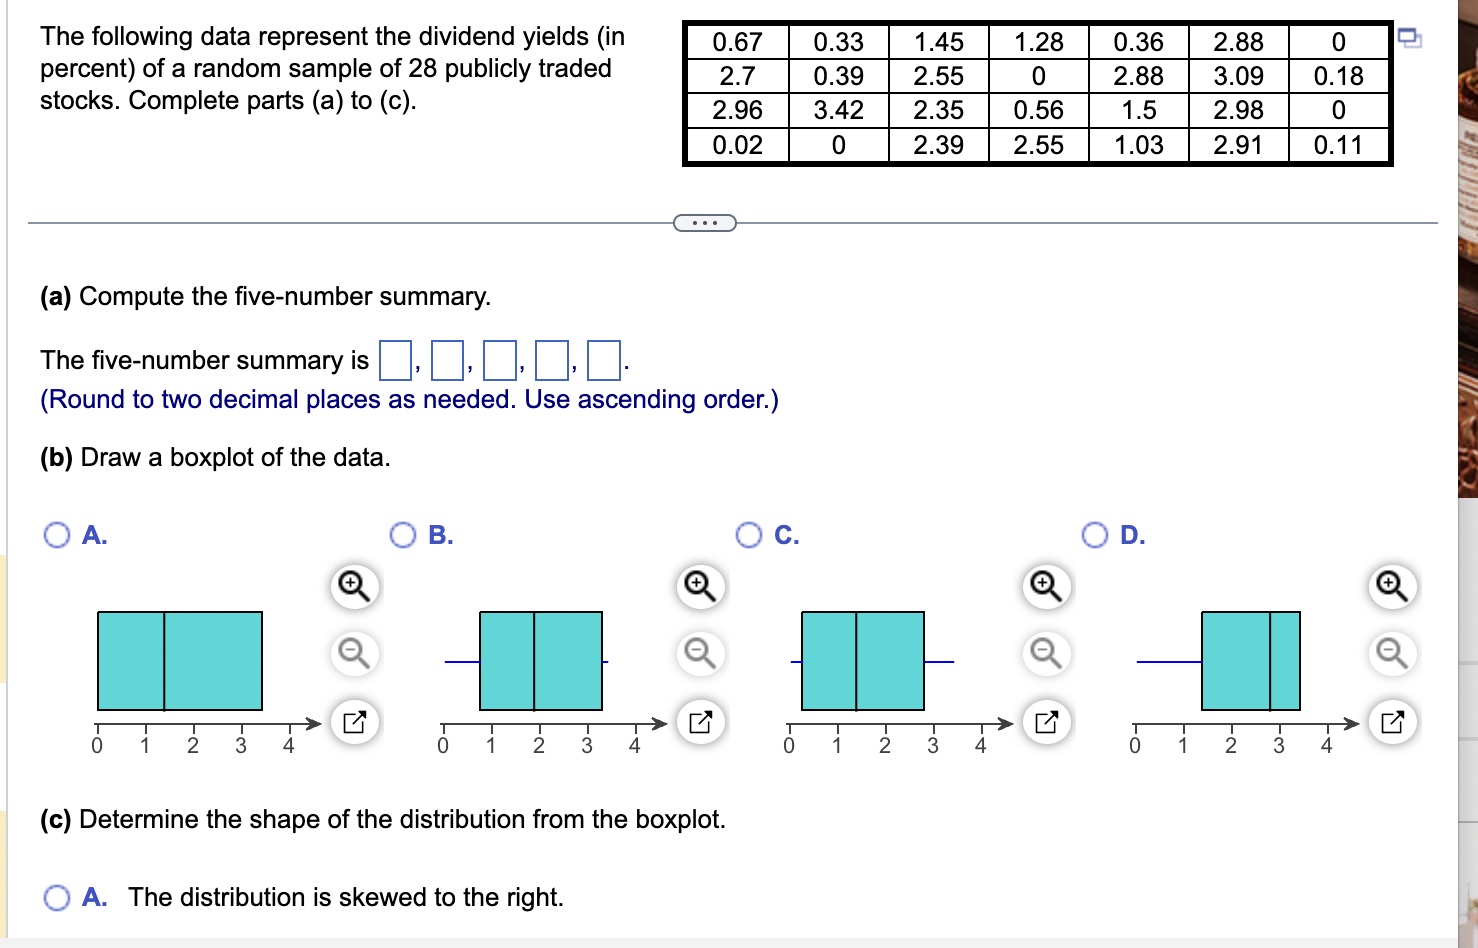
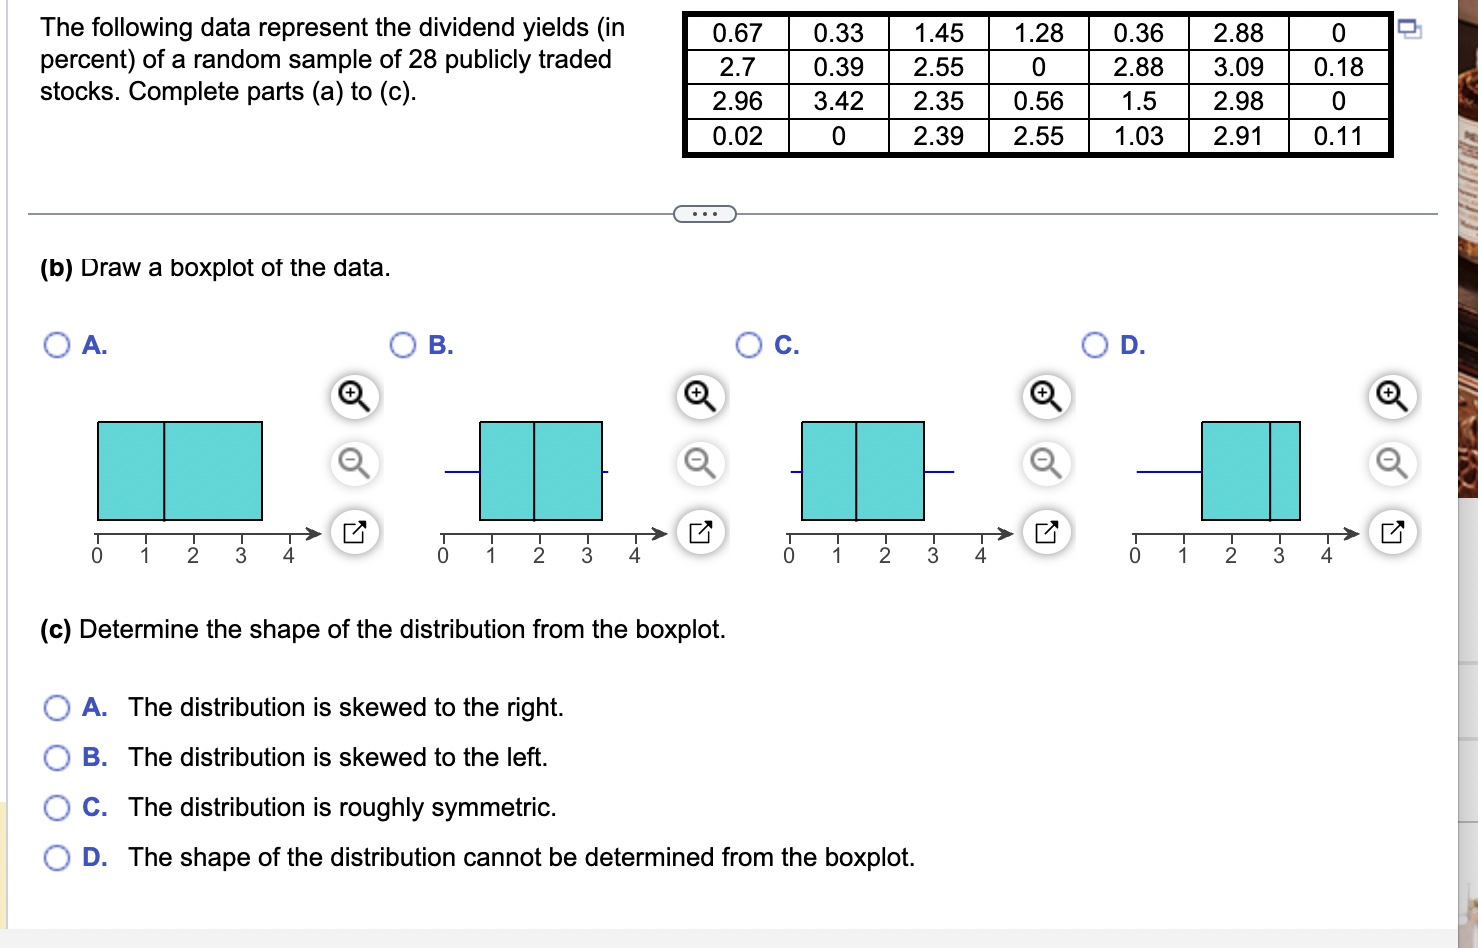


The following data represent the dividend yields (in 0.67 0.33 1.45 1.28 0.36 2.88 0 percent) of a random sample of 28 publicly traded 2.7 0.39 2.55 0 2.88 3.09 0. 18 stocks. Complete parts (a) to (c). 2.96 3.42 2.35 0.56 1.5 2.98 0 0.02 0 2.39 2.55 1.03 2.91 0.11 . . . (a) Compute the five-number summary. The five-number summary is,, , . (Round to two decimal places as needed. Use ascending order.) (b) Draw a boxplot of the data. O A. O B. O C. OD. + + + + 2 3 2 3 (c) Determine the shape of the distribution from the boxplot. O A. The distribution is skewed to the right.The following data represent the dividend yields (in 0.67 0.33 1.45 1.28 0.36 2.88 0 percent) of a random sample of 28 publicly traded 2.7 0.39 2.55 0 2.88 3.09 0.18 stocks. Complete parts (a) to (c). 2.96 3.42 2.35 0.56 1.5 2.98 0 0.02 0 2.39 2.55 1.03 2.91 0.11 . . . (b) Draw a boxplot of the data. O A. OB. O C. O D. + + + + 3 o 2 3 1 2 3 4 (c) Determine the shape of the distribution from the boxplot. O A. The distribution is skewed to the right. O B. The distribution is skewed to the left. O C. The distribution is roughly symmetric. O D. The shape of the distribution cannot be determined from the boxplot
Step by Step Solution
There are 3 Steps involved in it

Get step-by-step solutions from verified subject matter experts