

Question: The following data represent the high-temperature distribution for a summer month in a city for some of the last 130 years. Treat the data as
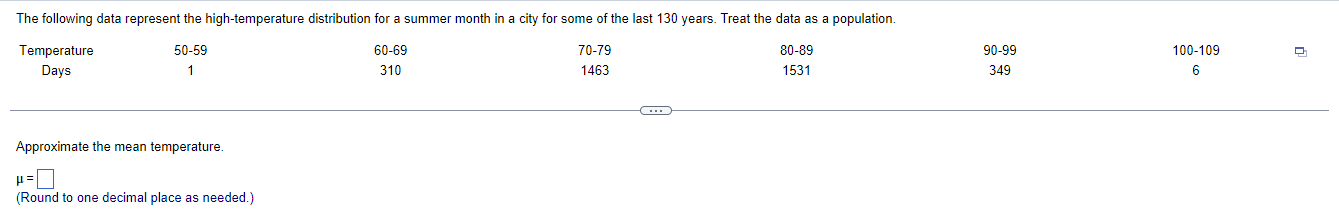
The following data represent the high-temperature distribution for a summer month in a city for some of the last 130 years. Treat the data as a population. Temperature 50-59 60-69 70-79 80-89 90-99 100-109 Days 1 310 1463 1531 349 6 Approximate the mean temperature. H = (Round to one decimal place as needed.)
Step by Step Solution
There are 3 Steps involved in it
1 Expert Approved Answer
Step: 1 Unlock

Question Has Been Solved by an Expert!
Get step-by-step solutions from verified subject matter experts
Step: 2 Unlock
Step: 3 Unlock