

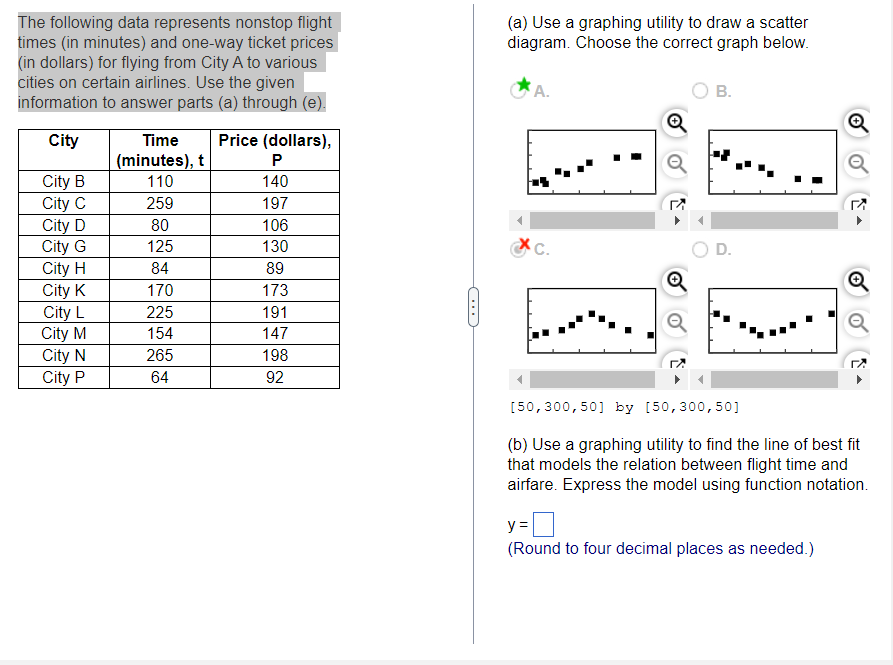
Question: The following data represents nonstop flight (a) Use a graphing utility to draw a scatter times (in minutes) and one-way ticket prices diagram. Choose the
Step by Step Solution
There are 3 Steps involved in it

Get step-by-step solutions from verified subject matter experts