

Question: The following data represents the math lab time (hours) that students spent the week before a final exam. 6, 5, 4, 0, 4, 8, 12,
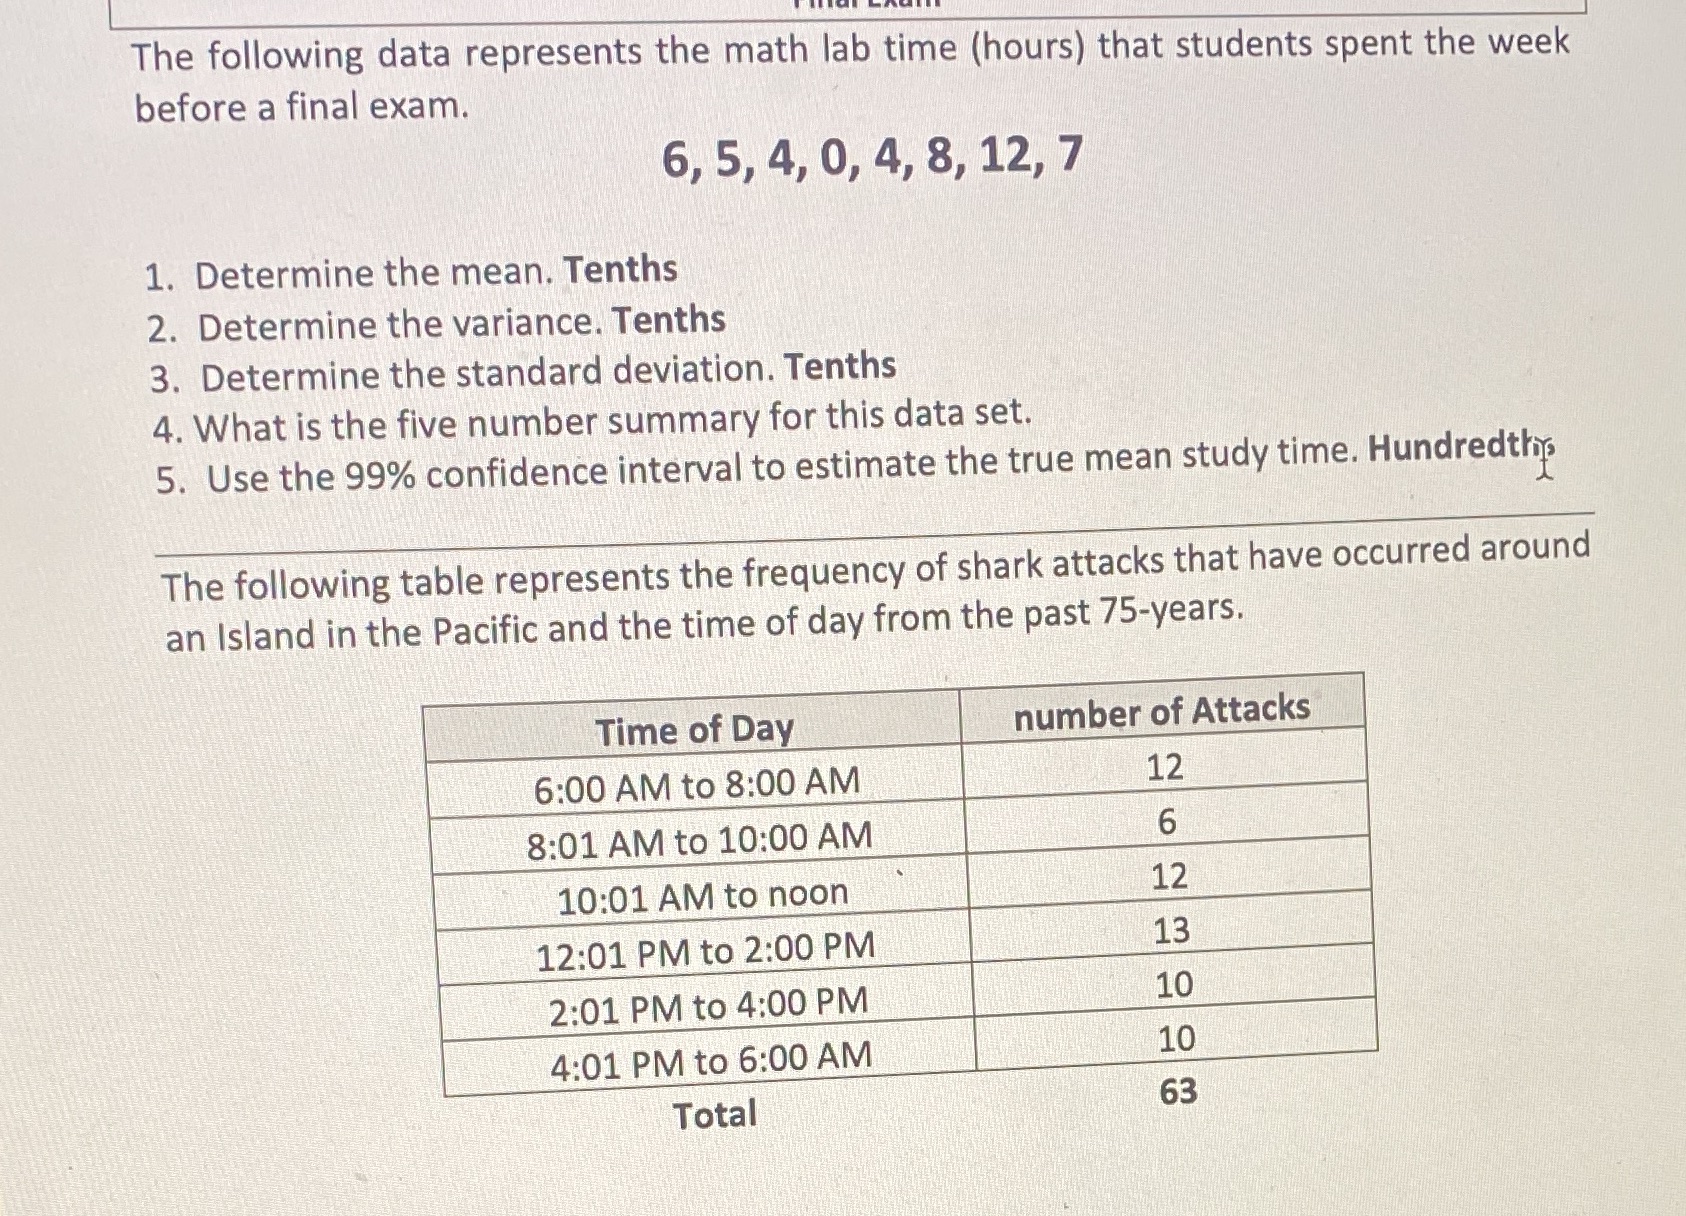

The following data represents the math lab time (hours) that students spent the week before a final exam. 6, 5, 4, 0, 4, 8, 12, 7 1. Determine the mean. Tenths 2. Determine the variance. Tenths 3. Determine the standard deviation. Tenths 4. What is the five number summary for this data set. 5. Use the 99% confidence interval to estimate the true mean study time. Hundredthy, The following table represents the frequency of shark attacks that have occurred around an Island in the Pacific and the time of day from the past 75-years. Time of Day number of Attacks 6:00 AM to 8:00 AM 12 8:01 AM to 10:00 AM 6 10:01 AM to noon 12 12:01 PM to 2:00 PM 13 2:01 PM to 4:00 PM 10 4:01 PM to 6:00 AM 10 Total 63
Step by Step Solution
There are 3 Steps involved in it

Get step-by-step solutions from verified subject matter experts