

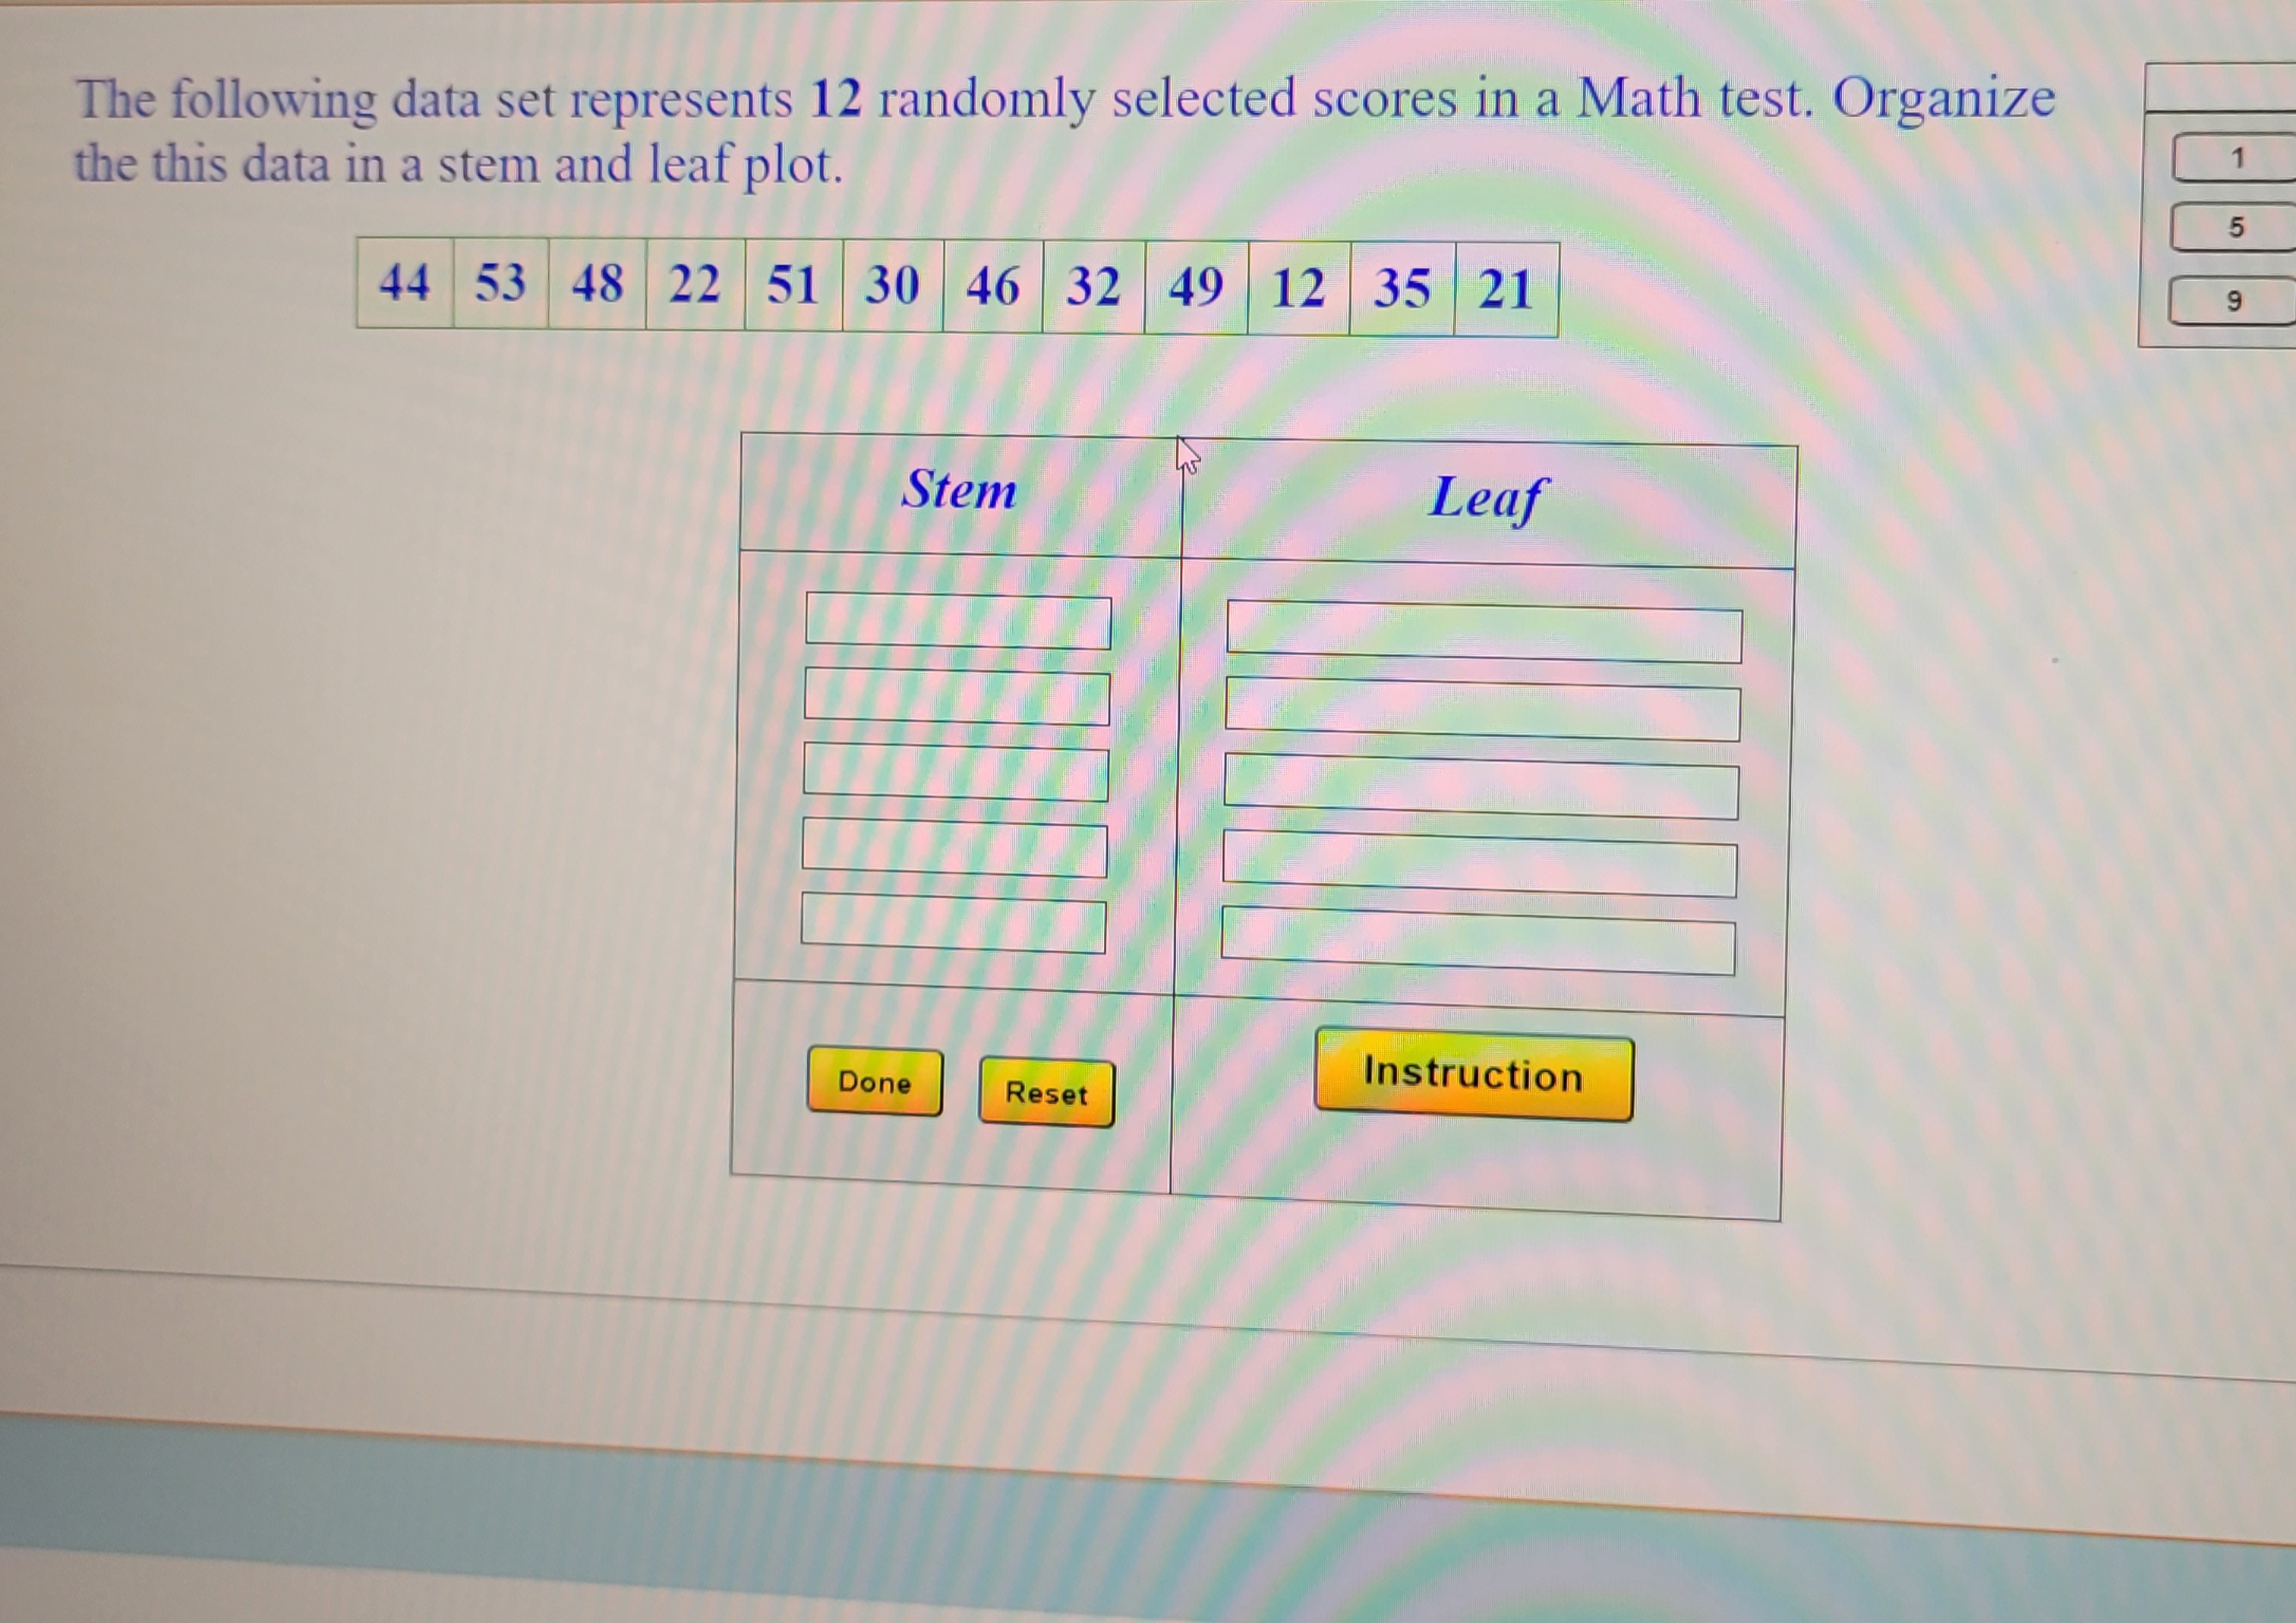
Question: The following data set represents 12 randomly selected scores in a Math test. Organize the this data in a stem and leaf plot. 1 5
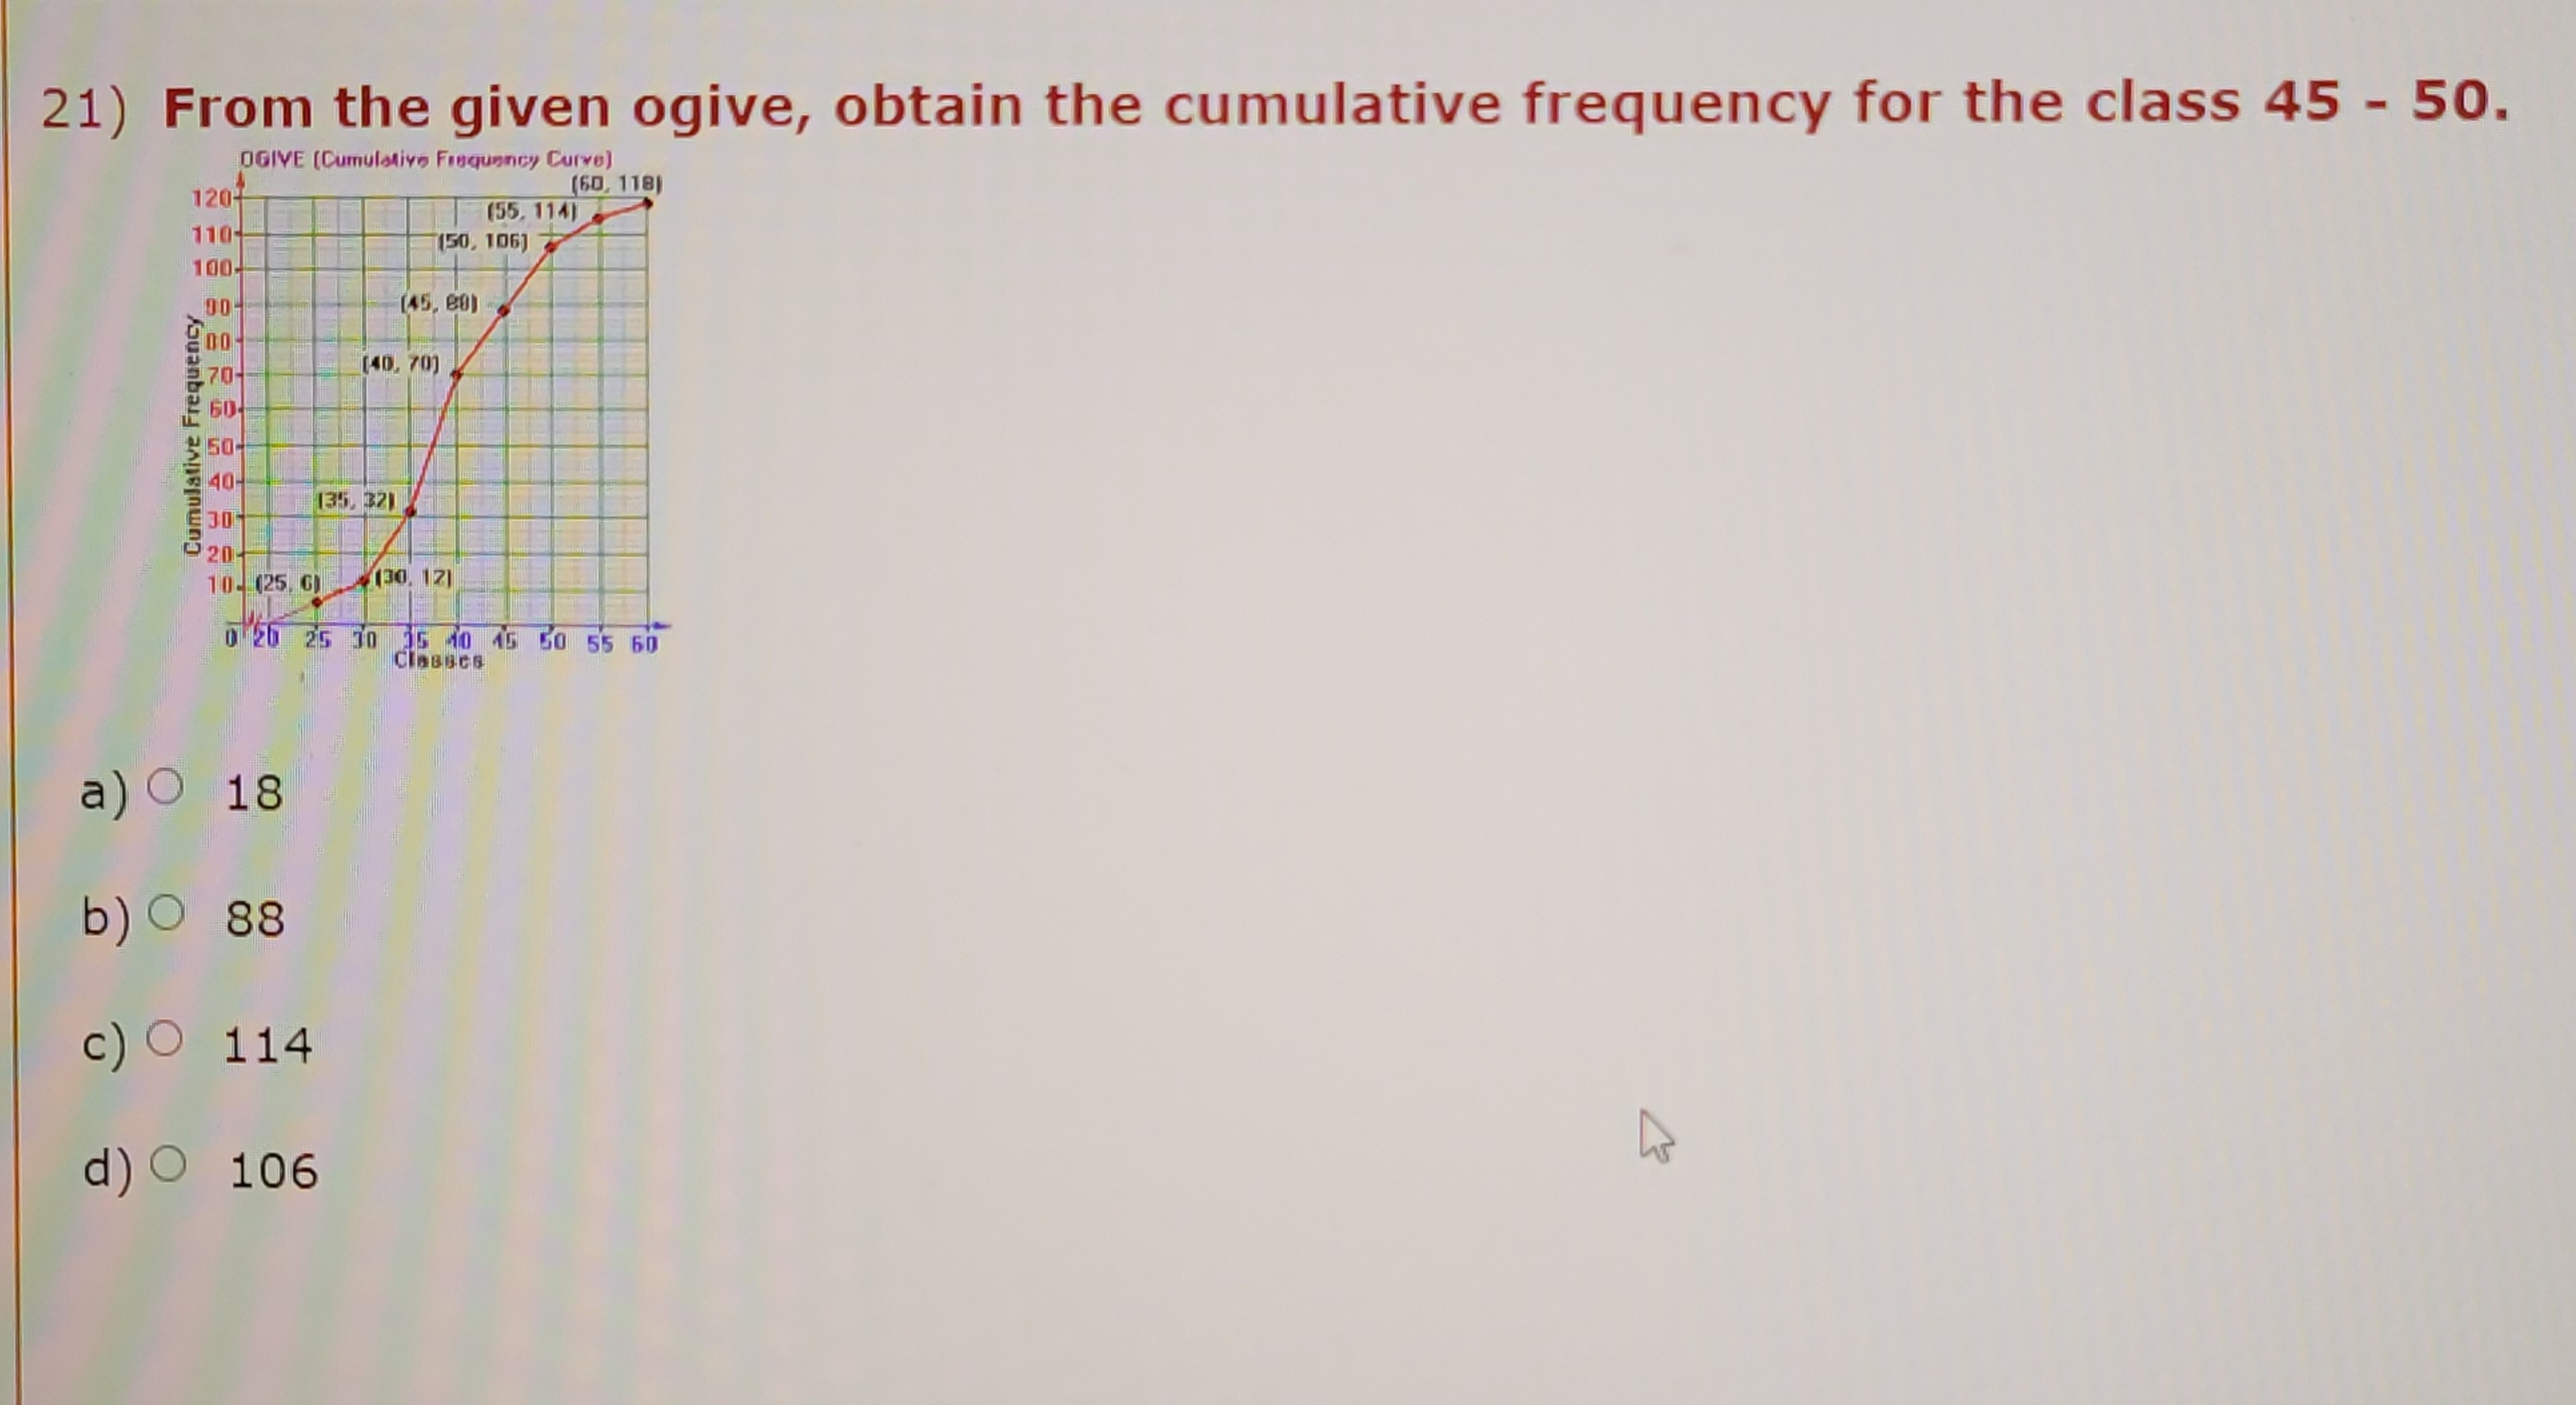
![Frequency Curve) 120- (60, 118) (55, 114) 110 (50, 106] 100- JO](https://dsd5zvtm8ll6.cloudfront.net/si.experts.images/questions/2024/09/66eed3c0689c3_80866eed3c018457.jpg)
![(45, 80) 570- (40, 70] 50 Cumulative Free 40- (35, 32) 30](https://dsd5zvtm8ll6.cloudfront.net/si.experts.images/questions/2024/09/66eed3c0d76e5_80866eed3c0b9a53.jpg)
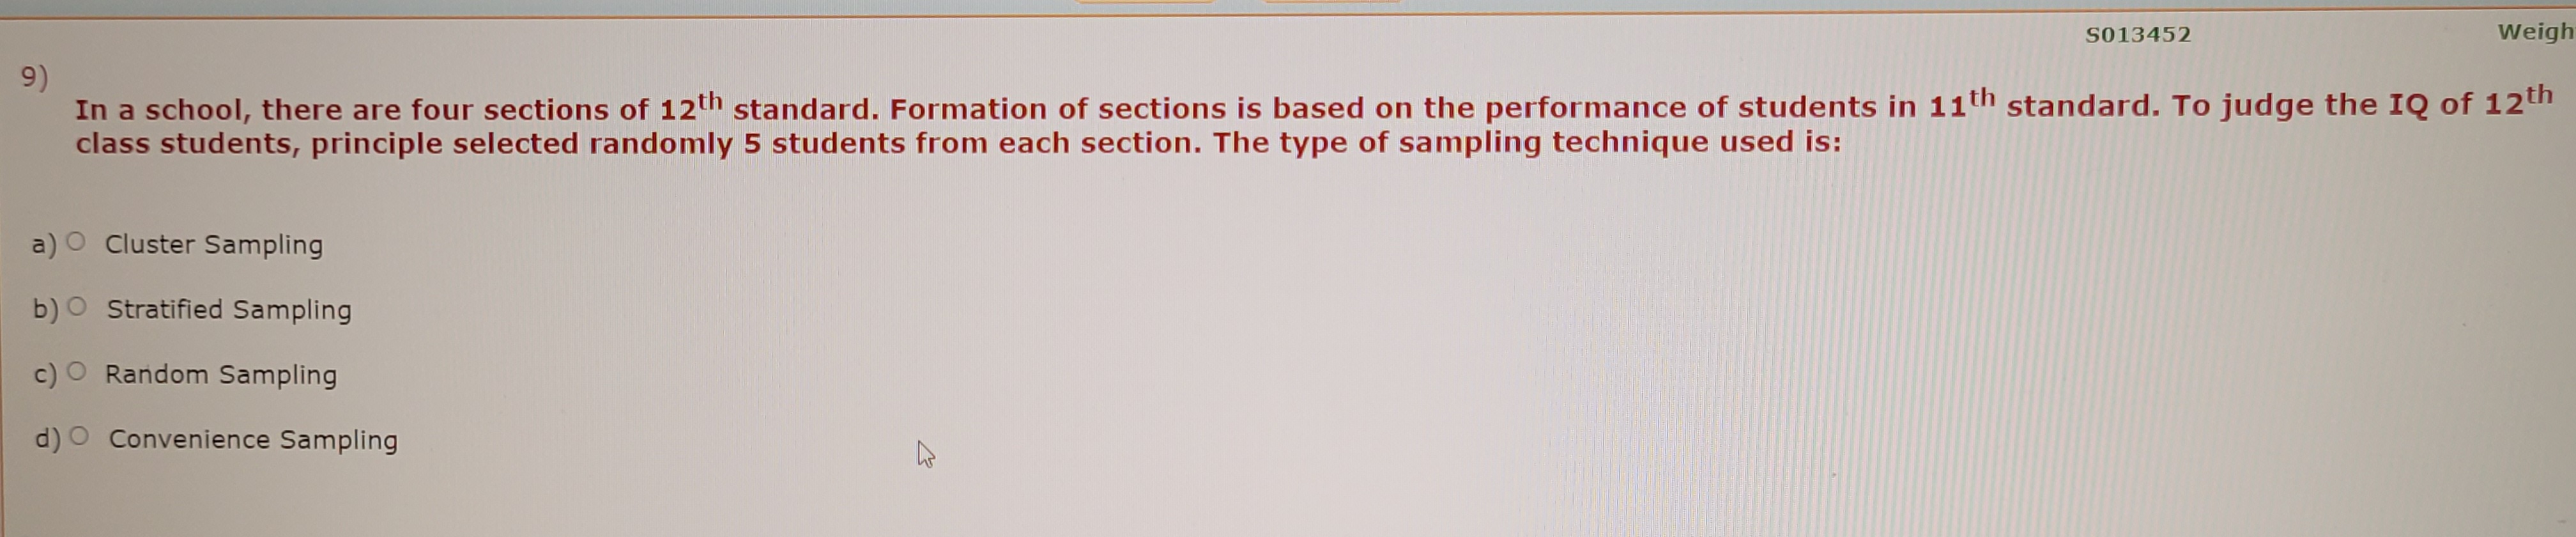
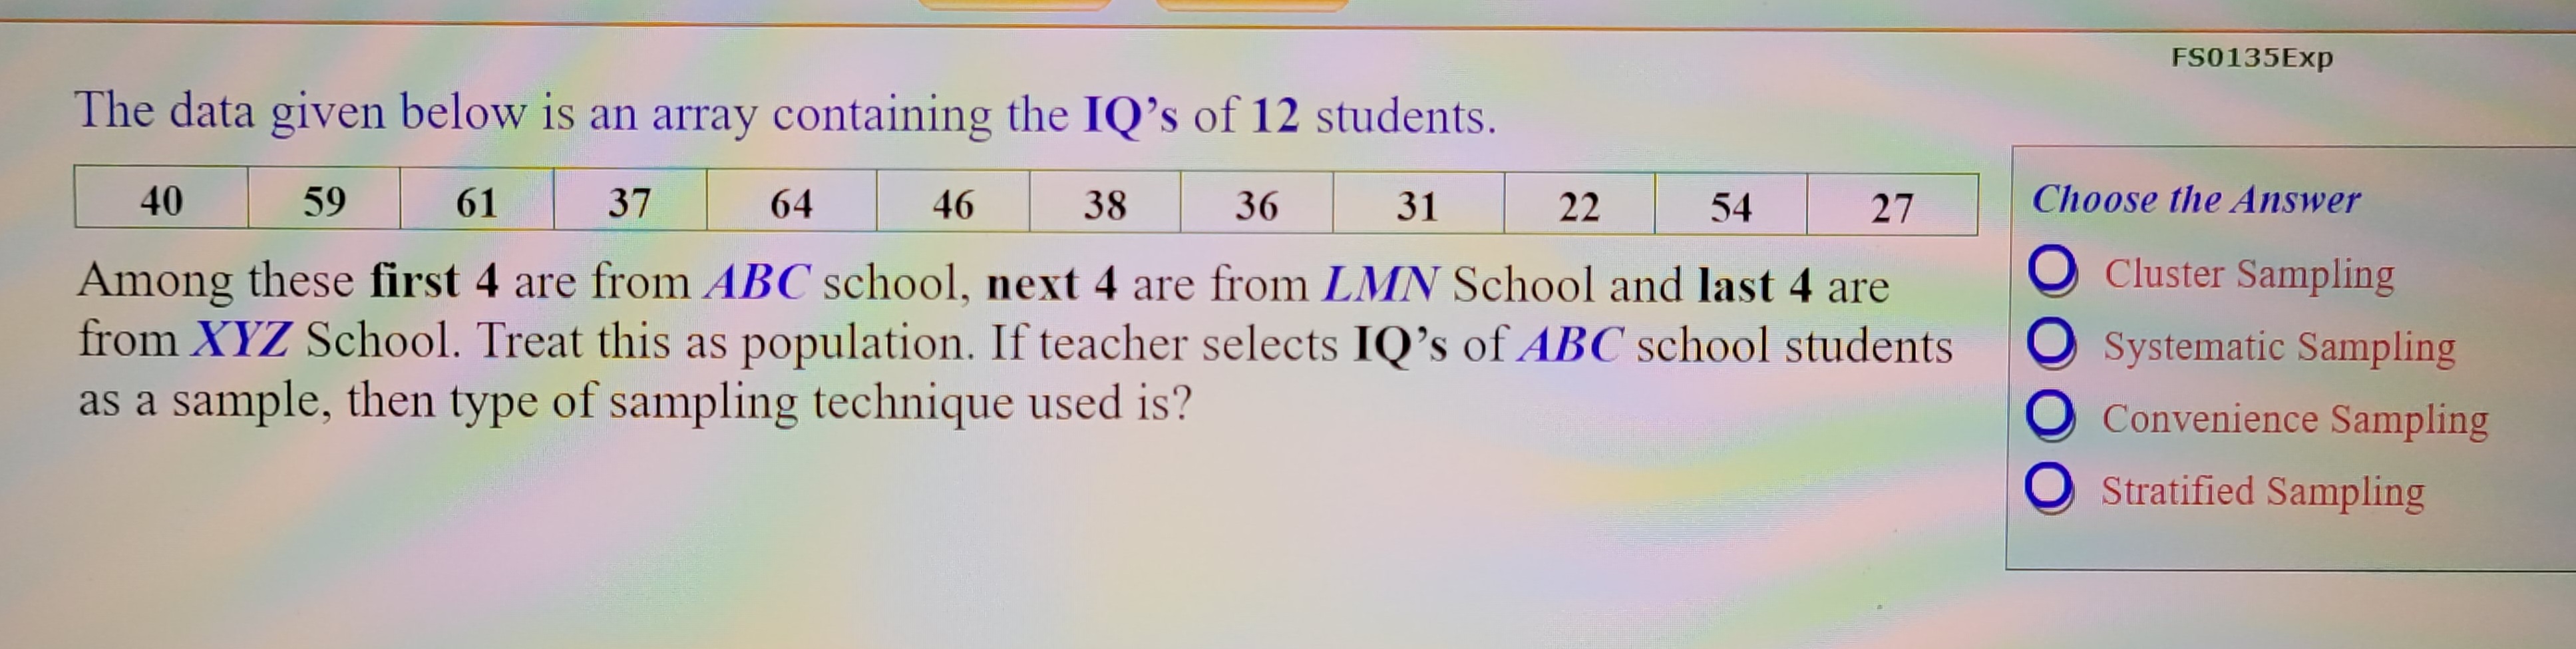
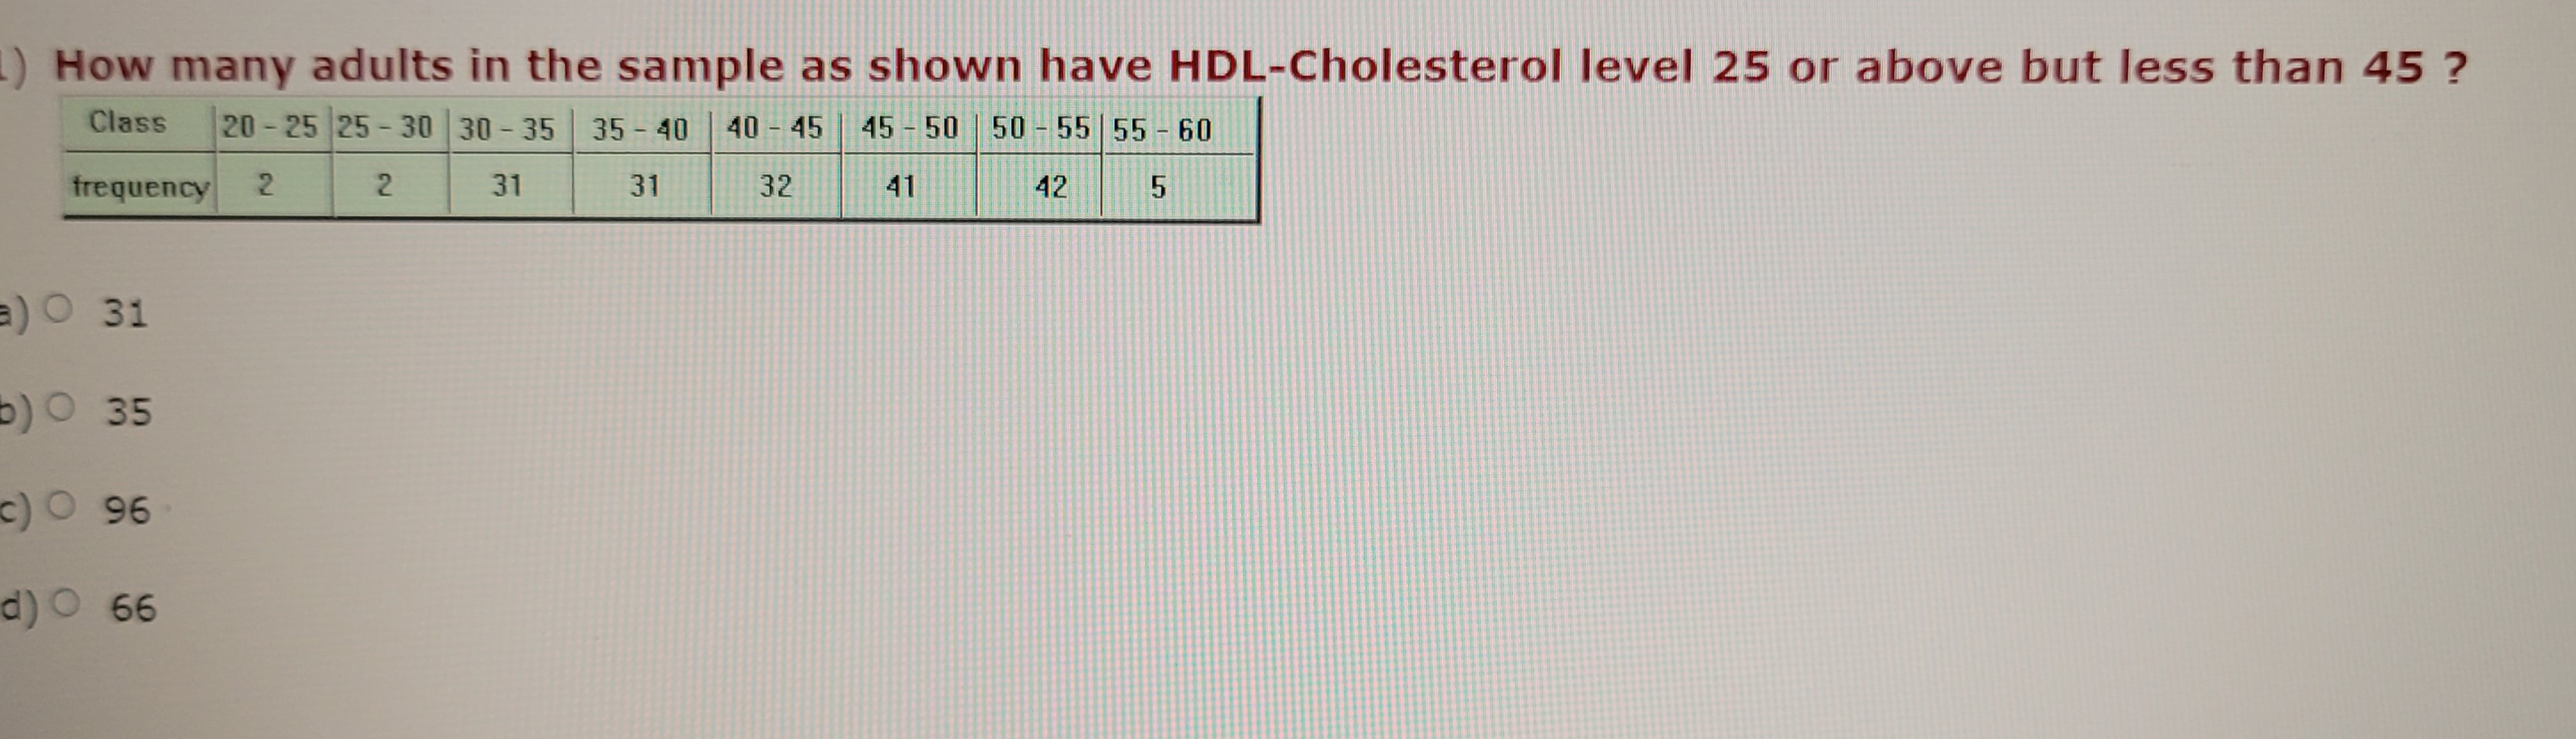
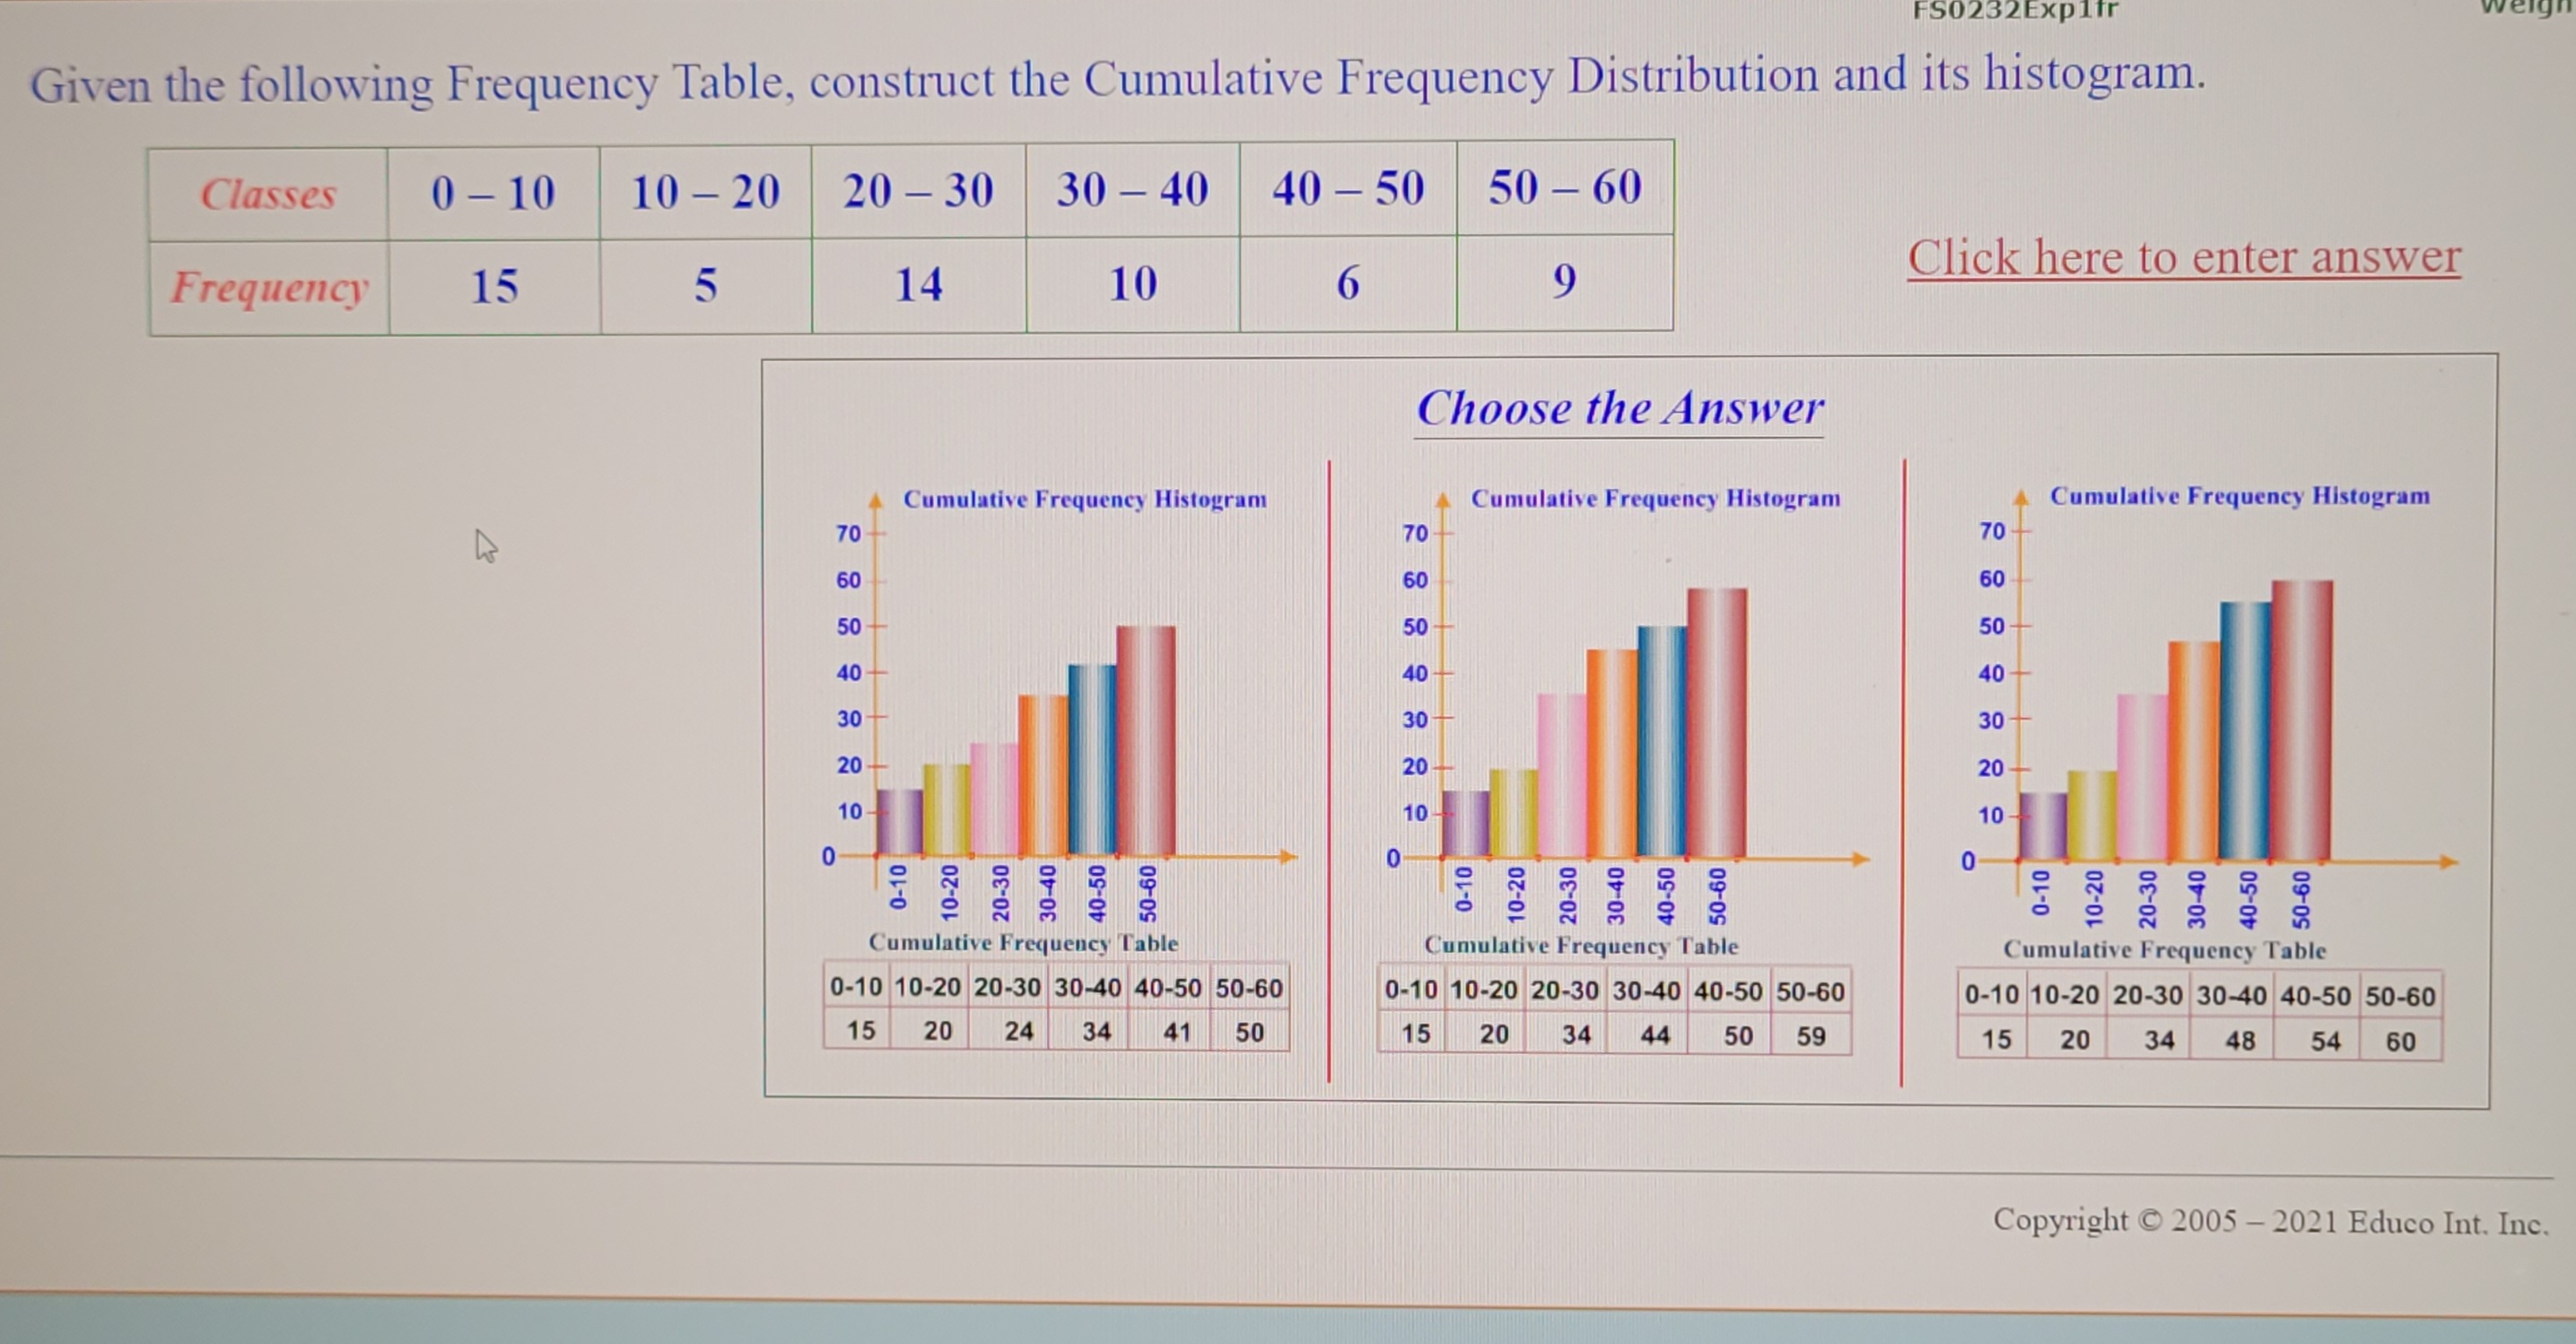
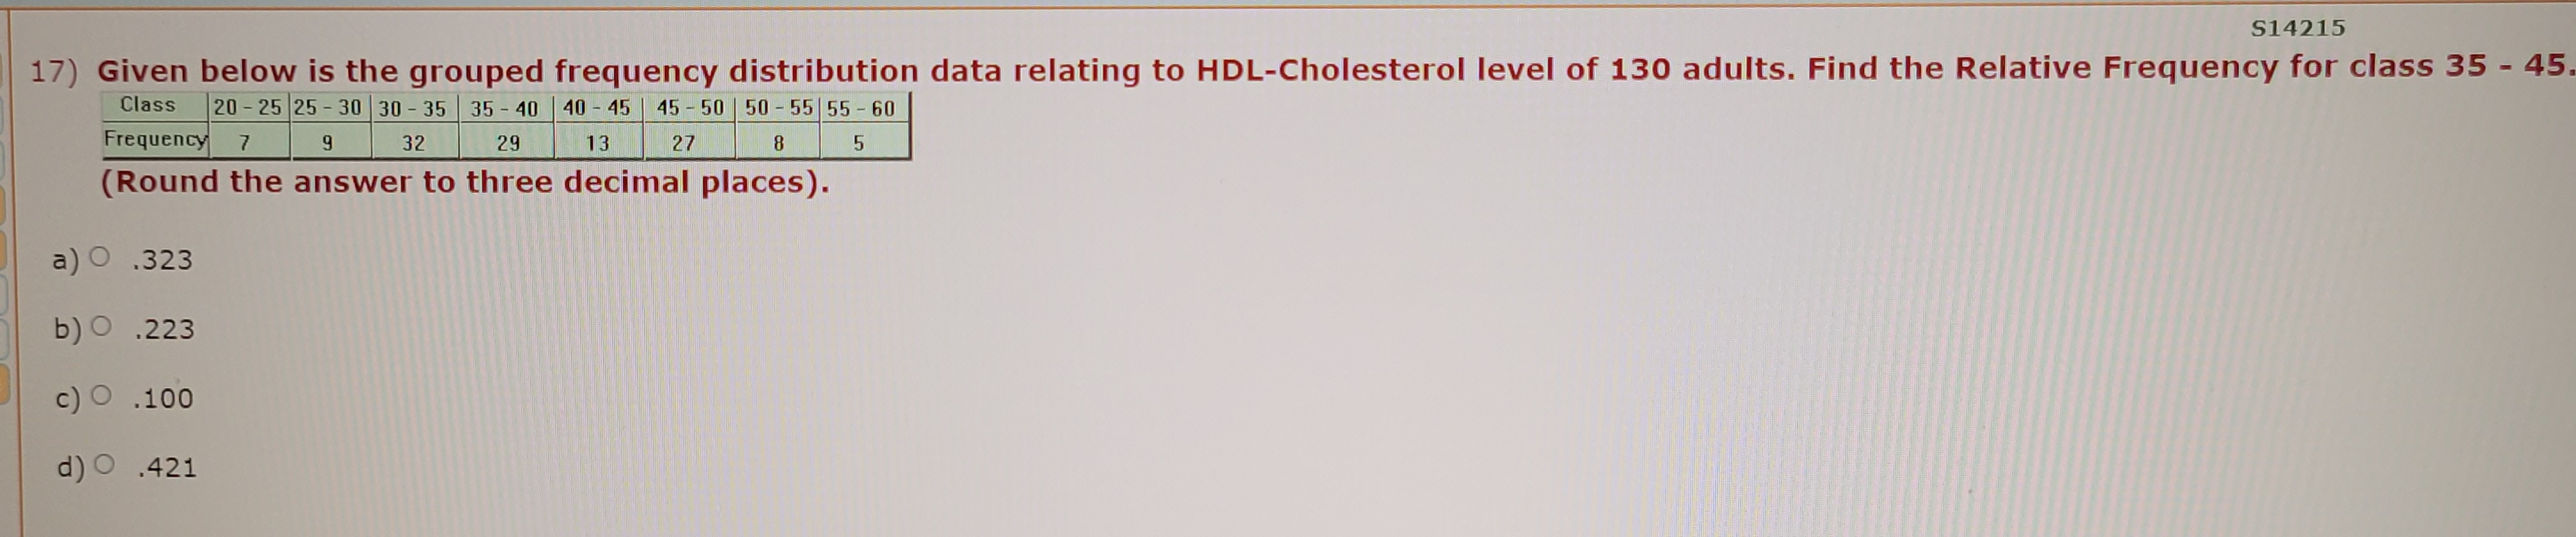
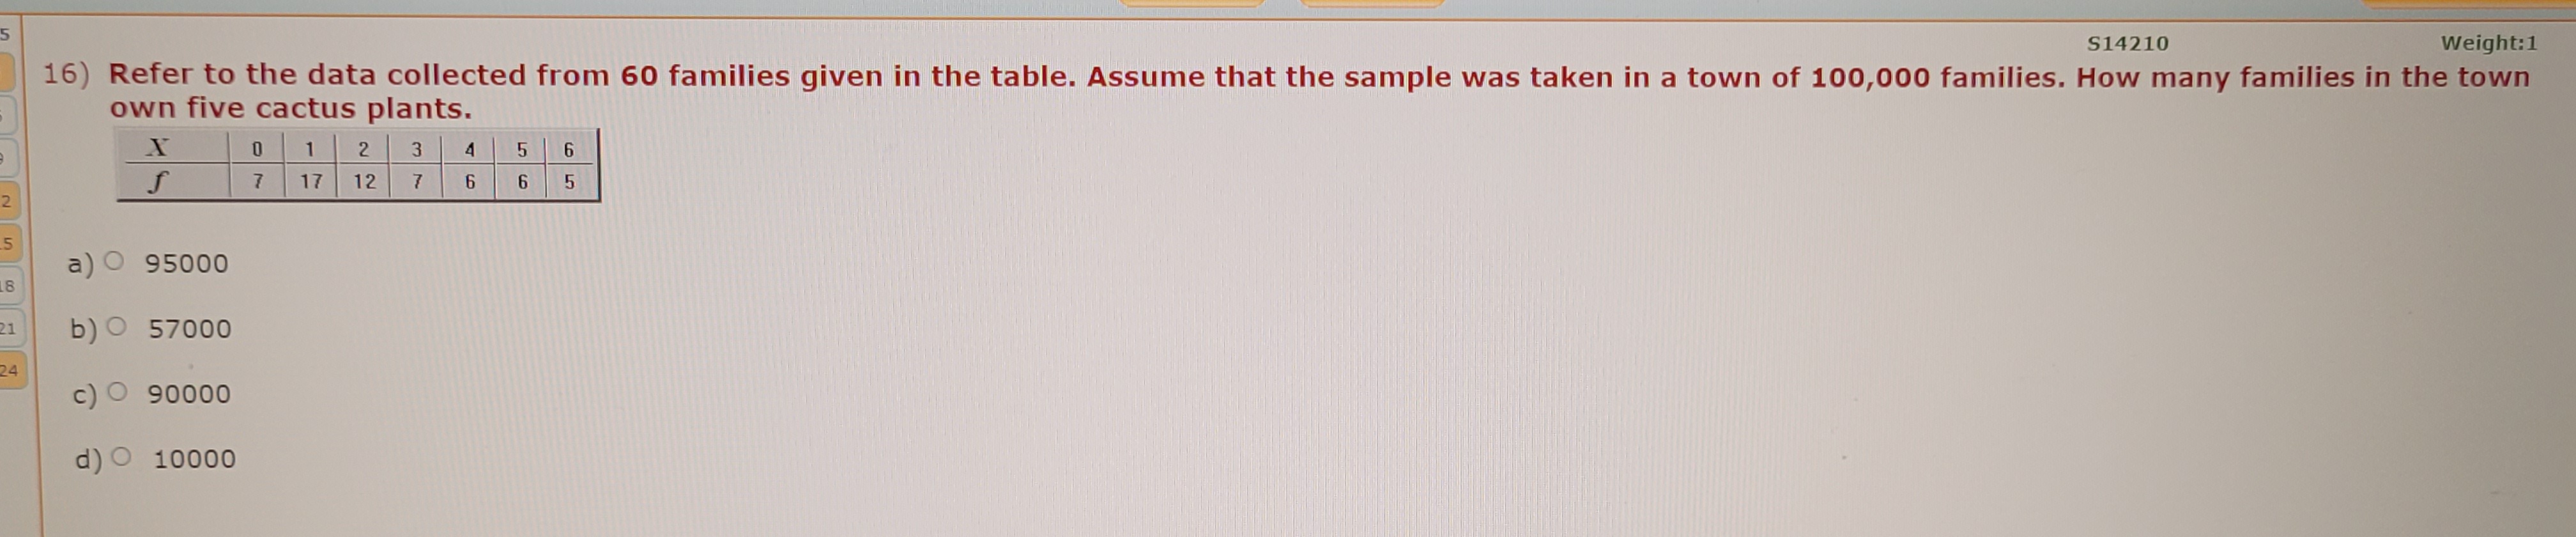
The following data set represents 12 randomly selected scores in a Math test. Organize the this data in a stem and leaf plot. 1 5 44 53 48 22 51 30 46 32 49 12 35 21 9 Stem Leaf Done Reset Instruction21) From the given ogive, obtain the cumulative frequency for the class 45 - 50. OGIVE (Cumulative Frequency Curve) 120- (60, 118) (55, 114) 110 (50, 106] 100- JO (45, 80) 570- (40, 70] 50 Cumulative Free 40- (35, 32) 30 20- 10- (25 6) (30. 121 0 20 25 30 35 10 45 50 55 60 Classes a) O 18 b) 0 88 c) 0 114 do 10632Explfr Given the following Frequency Table, construct the Cumulative Frequency Distribution and its histogram. Classes 0-10 10-20 20 -30 30- 40 40 -50 50 -60 Frequency 15 5 14 10 6 9 Click here to enter answer Choose the Answer Cumulative Frequency Histogram Cumulative Frequency Histogram Cumulative Frequency Histogram 70 70 70 60 60 60 50 50- 50 40 40 40 30 30 30 20- 20 20 10 10 10 0 0- 0- Cumulative Frequency Table Cumulative Frequency Table Cumulative Frequency Table 0-10 10-20 20-30 30-40 40-50 50-60 0-10 10-20 20-30 30-40 40-50 50-60 0-10 10-20 20-30 30-40 40-50 50-60 15 20 24 34 41 50 15 20 34 44 50 59 15 20 34 48 54 60 Copyright 2005 - 2021 Educo Int. Inc.S14215 17) Given below is the grouped frequency distribution data relating to HDL-Cholesterol level of 130 adults. Find the Relative Frequency for class 35 - 45 Class 20 - 25 25 - 30 30 -35 35 - 40 40 -45 45 -50 50 -55 55 -60 Frequency 7 9 32 29 13 27 8 5 (Round the answer to three decimal places). a) O .323 b)O .223 c) O .100 d) .421S14210 Weight: 1 16) Refer to the data collected from 60 families given in the table. Assume that the sample was taken in a town of 100,000 families. How many families in the town own five cactus plants. X 0 1 2 3 4 5 6 7 17 12 7 6 6 5 a) 0 95000 b) 0 57000 24 c) 90000 d) 10000FS0131ExpAL Prof. David wants to know the ages of moviegoers who see Star Wars. What kind of sample is it if he goes to parking lot of the theater and note last two digits of 12 cars, Choose the Answer arrange the numbers in ascending order and survey the corresponding person who emerge O Simple random Sampling from the theater. Convenience sampling O Systematic samplingFS0132Exp1AL Prof. Chris wants to know the ages of moviegoers who see Star Trek. What kind of sample is it if he survey the first 20 persons who emerge from the theater. Choose the Answer O Systematic sampling O Convenience sampling Simple random SamplingS013452 Weigh 9 ) In a school, there are four sections of 12" standard. Formation of sections is based on the performance of students in 11th standard. To judge the IQ of 12th class students, principle selected randomly 5 students from each section. The type of sampling technique used is: a) Cluster Sampling b) O Stratified Sampling c) O Random Sampling d) Convenience SamplingFS0135Exp The data given below is an array containing the IQ's of 12 students. 40 59 61 37 64 46 38 36 31 22 54 27 Choose the Answer Among these first 4 are from ABC school, next 4 are from LMN School and last 4 are O Cluster Sampling from XYZ School. Treat this as population. If teacher selects IQ's of ABC school students O Systematic Sampling as a sample, then type of sampling technique used is? O Convenience Sampling O Stratified SamplingHow many adults in the sample as shown have HDL-Cholesterol level 25 or above but less than 45 ? Class 20 -25 25 -30 30 -35 35 -40 40 -45 45 -50 50-55 55 -60 frequency 2 2 31 31 32 42 5 ) 0 31 0) 0 35 c) 0 96 d) 0 66
Step by Step Solution
There are 3 Steps involved in it

Get step-by-step solutions from verified subject matter experts