

Question: The following data show the marks (in %) achieved by a random sample of students in an end-ofyear examination: 62 78 88 63 50 66
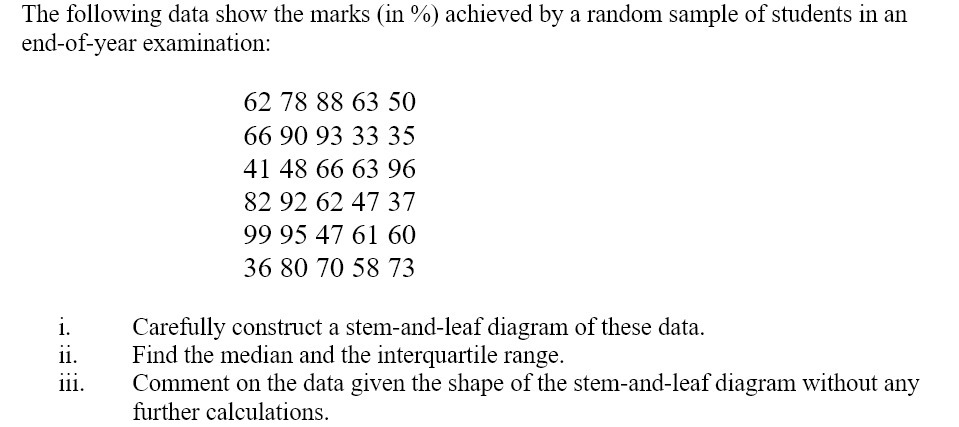
The following data show the marks (in %) achieved by a random sample of students in an end-ofyear examination: 62 78 88 63 50 66 90 93 33 35 4148 66 63 96 82 92 62 47 37 99 95 47 61 60 36 80 70 58 73 i. Carefully construct a stem-and-leaf diagram of these data. ii. Find the median and the interquartile range. iii. Comment on the data given the shape of the stem-and-leaf diagram without any further calculations
Step by Step Solution
There are 3 Steps involved in it
1 Expert Approved Answer
Step: 1 Unlock

Question Has Been Solved by an Expert!
Get step-by-step solutions from verified subject matter experts
Step: 2 Unlock
Step: 3 Unlock